

NQ Flow Report
It all begins with an idea.
Friday, November 21, 2025
Yesterday’s RTH Recap
Price opened inside the broad sell-side structure and continued lower through the morning before forming a temporary base near the midpoint of the distribution. Buyers attempted a late-session recovery but failed to reclaim the upper structure, leaving the broader tone controlled by sellers into the close.
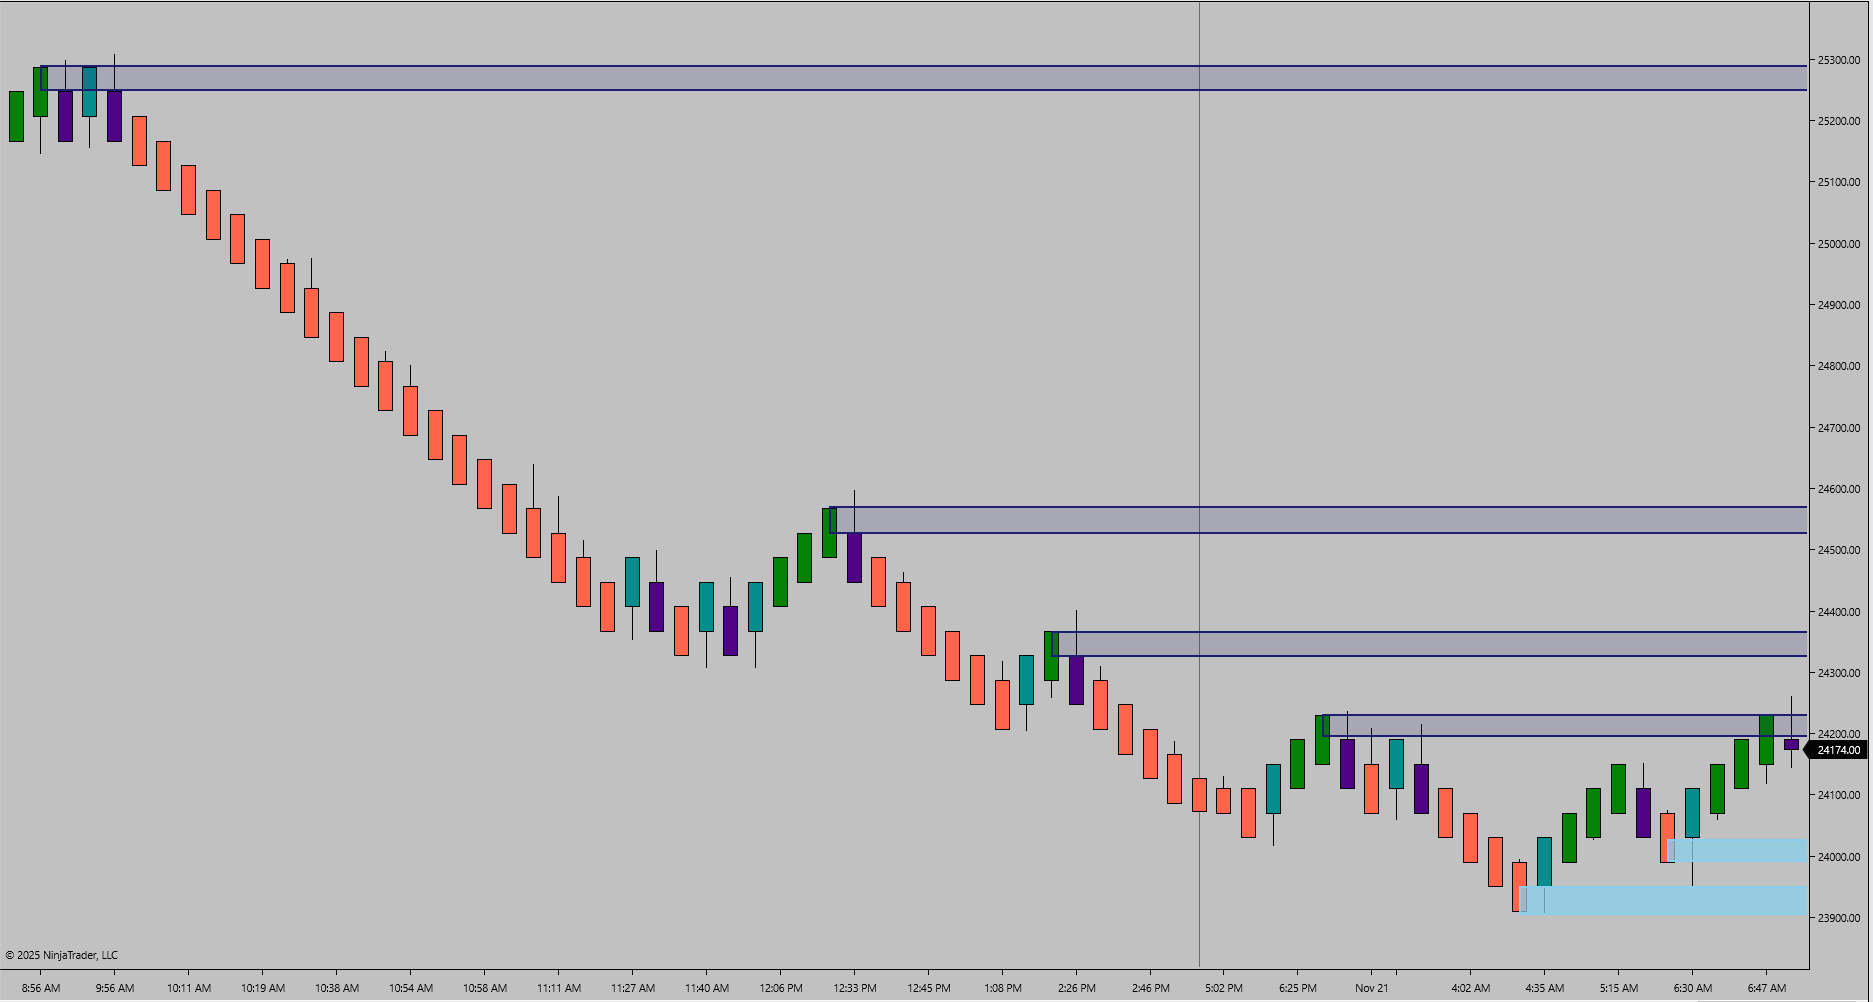
Figure 1 – RTH/ETH Structure Recap
Today’s ETH Framework
ETH built a steady upward rhythm throughout the session, making its high near 25209 and low near 25046.50. Buyers held control across each rotation, defending pullbacks and maintaining directional pressure toward the upper boundary. No meaningful weakness emerged during the overnight auction.
News and Economic Events
There are no high-impact scheduled economic events today.
Macro Structure
The nearest macro high sits at 25207.75 and the nearest macro low is 25046.50. Price is currently pressing against the upper macro boundary, signaling that buyers are testing for upward acceptance. A sustained defense above this region would shift the broader tone in favor of continuation.
Bias and Structure Outlook
Momentum across all layers is aligned to the upside. The structure is pressing against higher resistance, and buyers continue to control the tape as long as pullbacks remain shallow and defended.
A breakout and hold above the upper macro boundary opens continuation toward the next major distribution zone. Failure to hold above the mid-ETH shelf returns the session to a balanced rhythm inside the broader structure.
Key Levels
Type: Resistance Zone
Zone Range: 25190.00 – 25220.00
Comment: Upper ETH rejection band and first expansion test
Type: Resistance Zone
Zone Range: 25260.00 – 25295.00
Comment: Prior RTH upper distribution
Type: Support Zone
Zone Range: 25080.00 – 25050.00
Comment: Macro low alignment and defended buyer shelf
Type: Support Zone
Zone Range: 24980.00 – 24940.00
Comment: Broader continuation pocket if pullback develops
Type: Trigger Level
Level: 25220.00
Comment: Required for confirmed upward expansion
Bias Summary
Bias: Bullish
Nearest Macro High: 25207.75
Nearest Macro Low: 25046.50
Validation Level: 25220.00
Trader Tip
Momentum alignment means nothing without structure. Use the upper boundary as your validator. Only confirmed expansion deserves risk.
NQ Flow Report
It all begins with an idea.
Thursday, November 20, 2025
Yesterday’s RTH Recap
The RTH session traded between 24988 and 24507. Buyers attempted to stabilize the midpoint during the morning but were unable to break through overhead structure. Sellers maintained pressure throughout the afternoon, closing the session near the lower boundary and keeping the broader tone defensive.
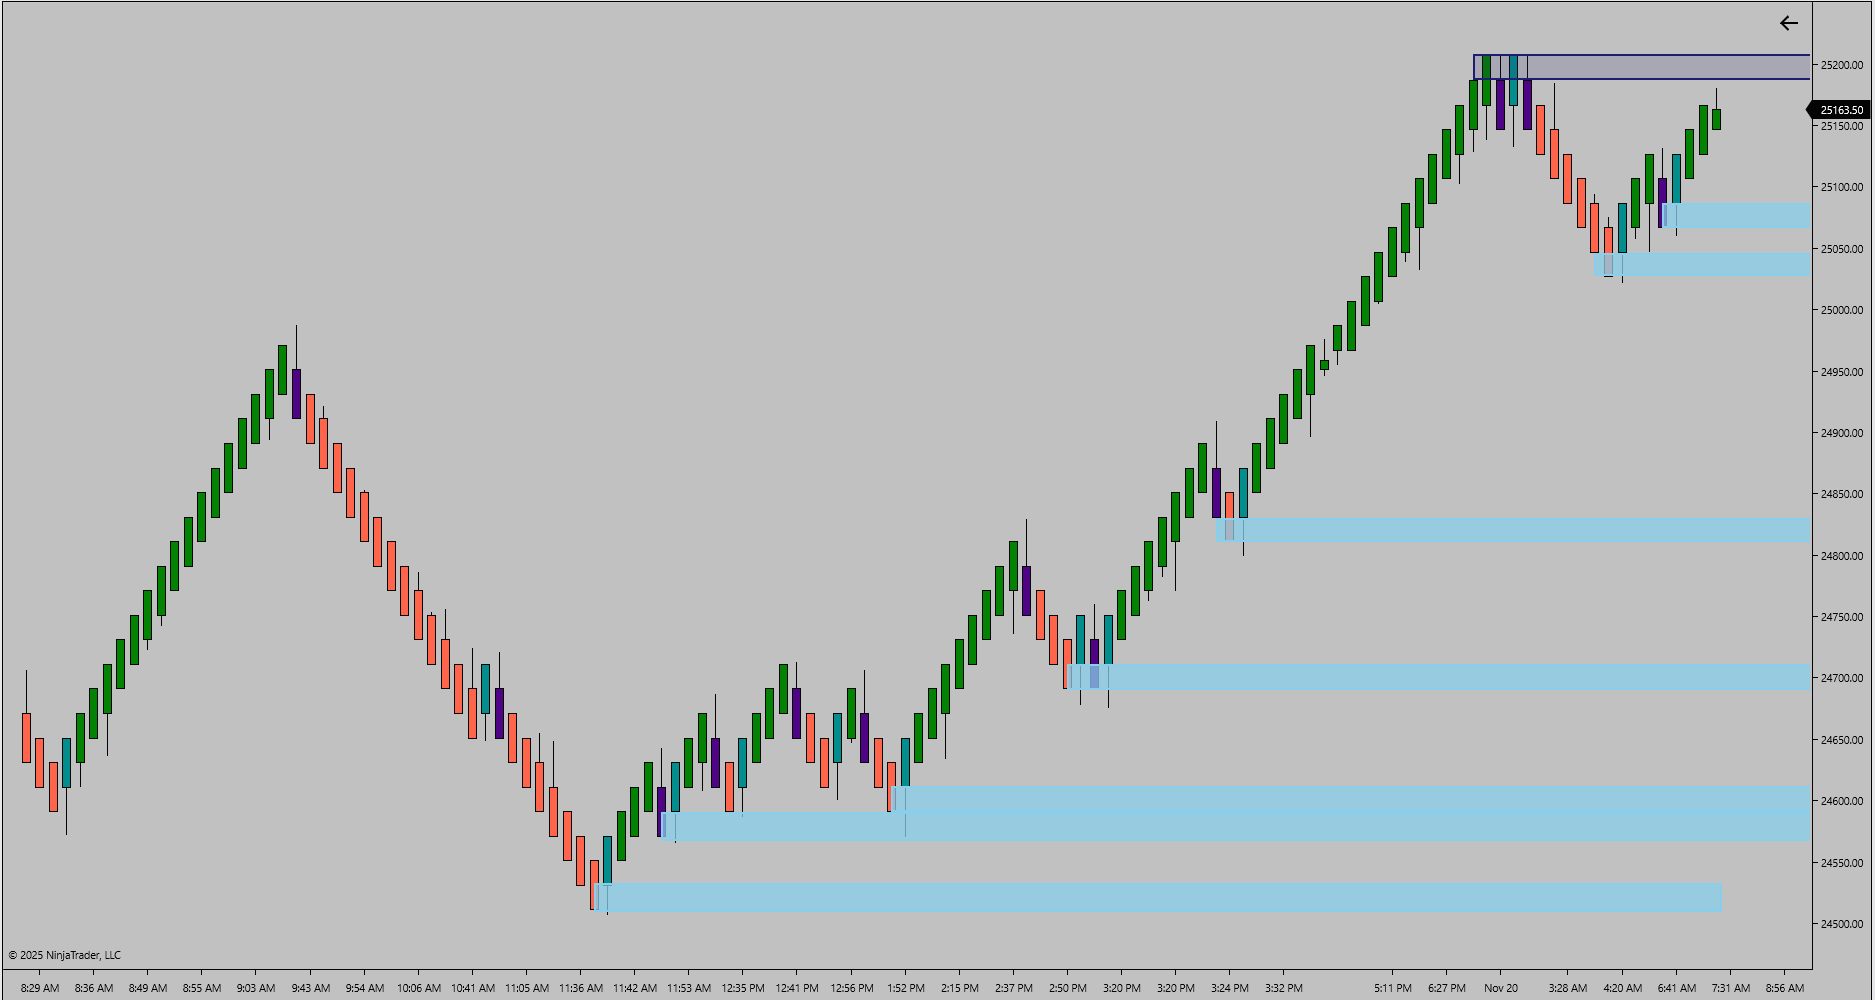
Figure 1 – RTH/ETH Structure Recap
Today’s ETH Framework
ETH printed a high of 25209 and a low of 25046.50. Price rotated inside a narrow range just above the nearest macro low at 25046.50. Buyers defended the lower boundary cleanly, but no confirmed acceptance above the upper structure has developed. The ETH high sits directly beneath the nearest macro high at 25207.75, creating a tight macro band for the session.
News and Economic Events
No high-impact economic events scheduled for this morning.
Macro Structure
The nearest macro high is 25207.75 and the nearest macro low is 25046.50. Price is currently trapped within this compressed macro band. A breakout beyond either boundary will determine directional intent for the session.
Bias and Structure Outlook
Price begins the session inside a compact structural pocket. A clean move above 25210 would open the path toward prior RTH supply zones. Failure to hold above 25046.50 exposes a return toward yesterday’s lower distribution between 24700 and 24500. Until a boundary breaks, expect balanced rotation inside the macro band.
Key Levels
Type: Resistance Zone
Zone Range: 25190 – 25220
Comment: Macro high alignment and ETH upper boundary
Type: Resistance Zone
Zone Range: 25090 – 25140
Comment: Intraday rejection cluster
Type: Support Zone
Zone Range: 25060 – 25040
Comment: Macro low alignment and defended ETH base
Type: Support Zone
Zone Range: 24850 – 24780
Comment: Deeper continuation pocket if breakdown occurs
Type: Trigger Level
Zone Range: 25220
Comment: Must be reclaimed to confirm upside expansion
Bias Summary
Bias: Neutral
Nearest Macro High: 25207.75
Nearest Macro Low: 25046.50
Validation Level: 25220
Trader Tip
When price is pinned between macro boundaries, the first side to achieve acceptance often controls the entire session. Let structure break before committing instead of reacting to early rotation.
NQ Flow Report
It all begins with an idea.
Wednesday, November 19, 2025
Yesterday’s RTH Recap
The RTH session traded between 24832.00 and 24376.25. Price attempted a mid-session recovery but failed to break above the upper structure, leaving sellers in control into the close. The session ended near the lower boundary of the range, maintaining a defensive tone heading into ETH.
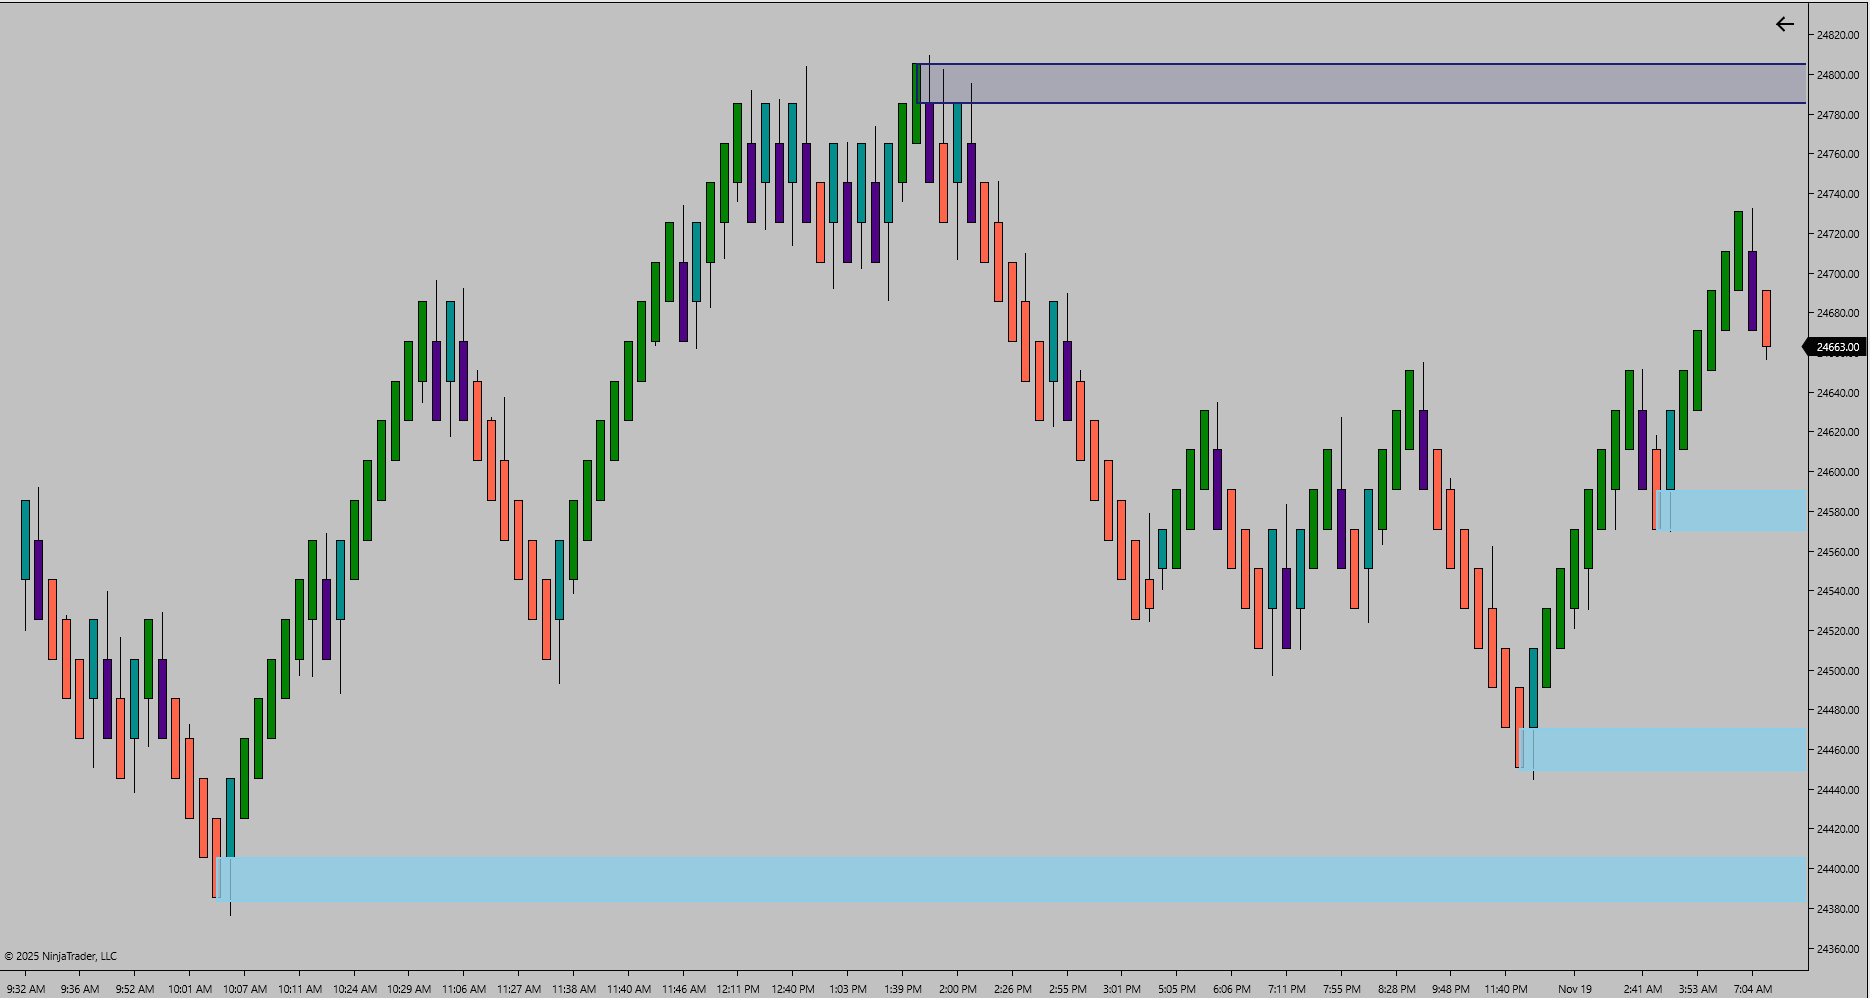
Figure 1 – RTH/ETH Structure Recap
Today’s ETH Framework
ETH printed a high of 24733.25 and a low of 24445.00. Price rotated inside a tight lower structure, with sellers defending the upper boundary and buyers not producing a sustained response. The ETH low sits just above the macro low at 24472.50, creating a key reference for today’s session.
News and Economic Events
Building Permits (08:30 EST)
Housing Starts (08:30 EST)
Macro Structure
The nearest macro high sits at 24785 and the nearest macro low at 24472.50. Price remains inside this lower macro band and continues to respect both edges without acceptance beyond either boundary.
Bias and Structure Outlook
The session remains inside a compressed macro range. Attempts to lift must break through resistance near the macro high to shift tone away from defensive. Failure to hold above the ETH low exposes continuation toward the deeper 24380–24320 region. Until a boundary breaks, structure favors two-sided rotation with sellers retaining slight advantage.
Key Levels
Type: Resistance Zone
Zone Range: 24760.00 – 24790.00
Comment: Macro high alignment and first upside validation zone
Type: Resistance Zone
Zone Range: 24680.00 – 24720.00
Comment: ETH rejection cluster
Type: Support Zone
Zone Range: 24480.00 – 24440.00
Comment: ETH low alignment and macro low region
Type: Support Zone
Zone Range: 24390.00 – 24330.00
Comment: Broader continuation pocket if breakdown occurs
Type: Trigger Level
Zone Range: 24790.00
Comment: Required for acceptance toward higher distribution
Bias Summary
Bias: Neutral-Defensive
Nearest Macro High: 24785
Nearest Macro Low: 24472.50
Validation Level: 24790.00
Trader Tip
Macro bands define intent. When price holds between a macro high and macro low without acceptance, the market is signaling neutrality. Wait for the boundary break before committing to direction.
NQ Flow Report
It all begins with an idea.
Tuesday, November 18, 2025
Yesterday’s RTH Recap
Price rotated between 25361.25 and 24731.75, with buyers attempting to build a mid-session base before losing control late in the day. Sellers reclaimed pressure into the close, leaving the broader structure tilted defensive. The session ended inside the lower portion of the distribution, maintaining downside weight into the overnight session.
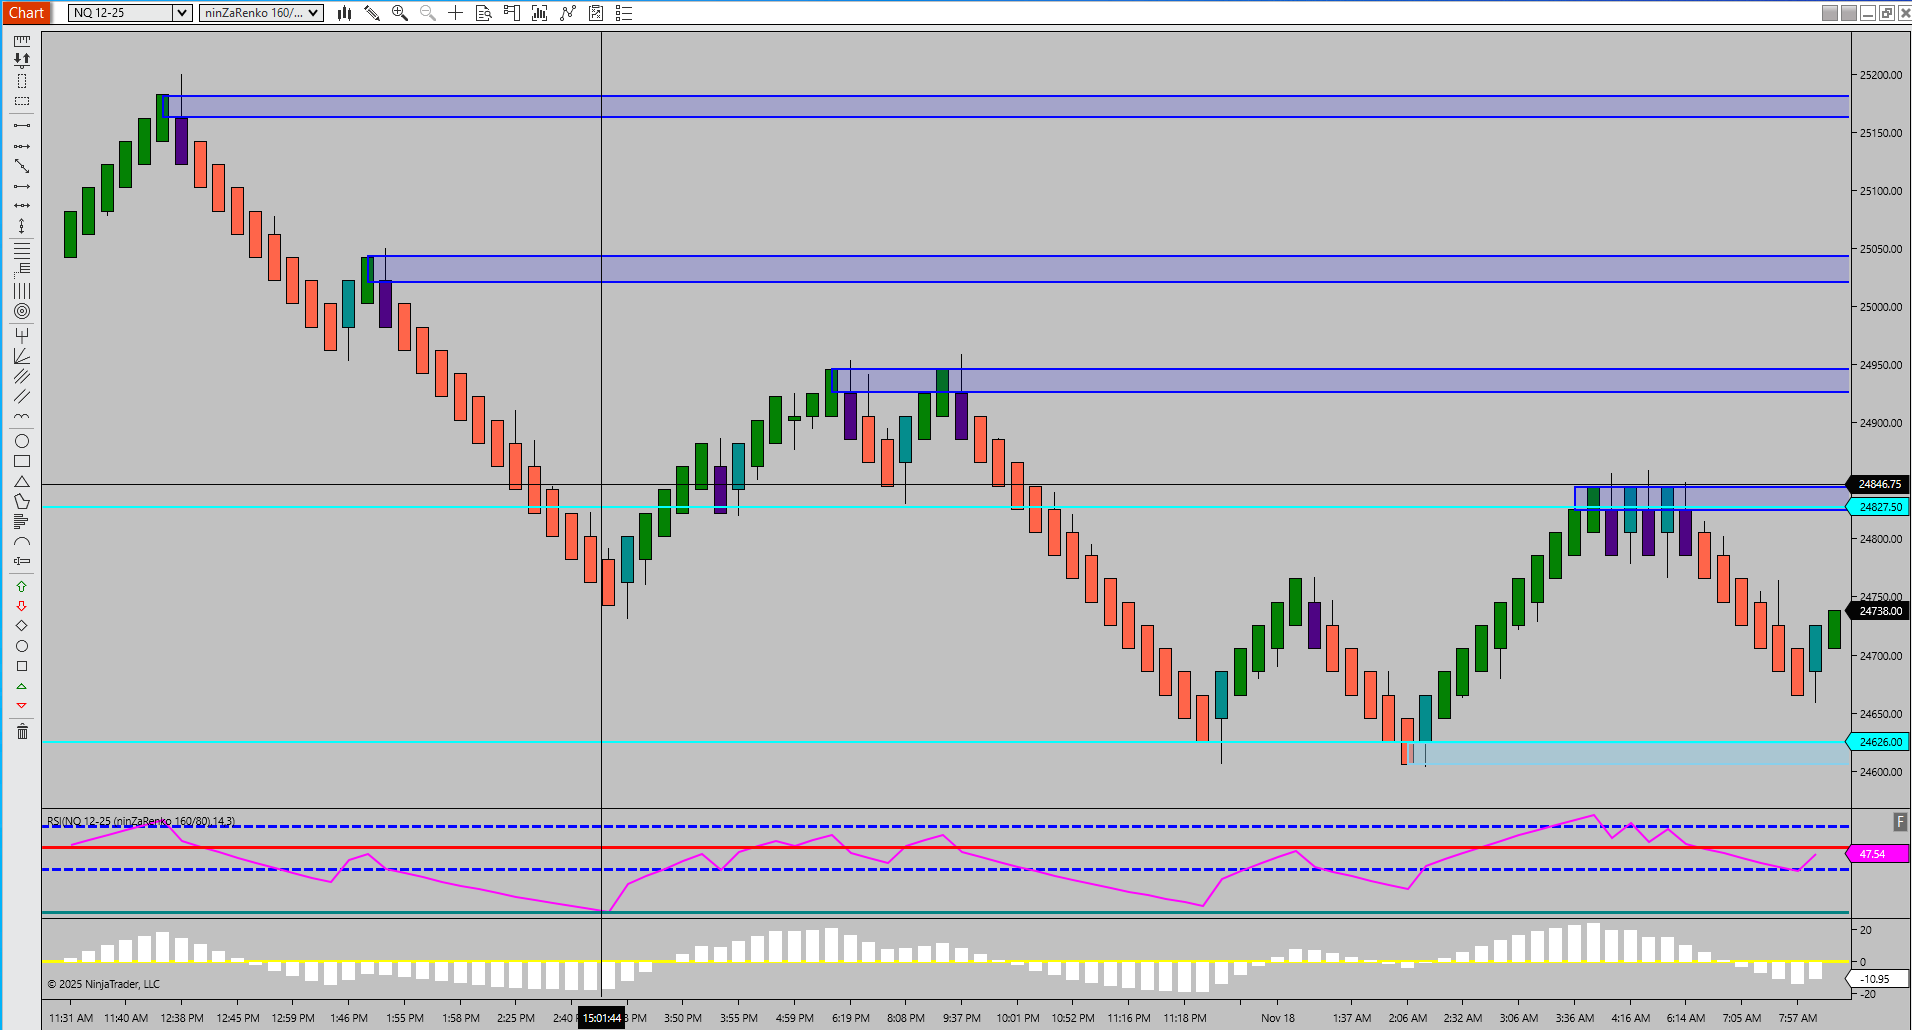
Figure 1 – RTH/ETH Structure Recap
Today’s ETH Framework
ETH established a high at 24959.50 and a low at 24603.75. The upper boundary sits just below yesterday’s failed recovery zone, while the lower boundary aligns with a defended region from the prior session. Price continues to rotate inside the tight macro band formed by the macro high at 24827.50 and macro low at 24626.00. No meaningful shift has emerged from overnight trade, and buyers have not produced a sustained defense.
News and Economic Events
No news today
RTH Momentum Summary
• Intermediate layer: compression
• High-timeframe layer: compression
• Macro layer: compression
All three layers are compressing, signaling a coiled market with no clear conviction. Expansion from this compression will determine the dominant side of today’s session.
Macro Structure
The macro band between 24827.50 and 24626.00 continues to define the session. Price remains inside this structure, and neither side has secured acceptance above or below the boundaries. The broader tone remains defensive until the upper region is reclaimed.
Bias and Structure Outlook
The market is operating inside a compact macro band with compression across all layers. This suggests the session may continue to oscillate until one boundary breaks.
• Acceptance above 24830.00 would allow buyers to press toward yesterday’s upper distribution zones.
• Breakdown through 24620.00 exposes continuation into the deeper 24500–24450 region.
Until directional expansion shows, the session is structure-driven rather than trend-driven.
Key Levels
Type: Resistance Zone
Zone Range: 24820.00 – 24840.00
Comment: Macro high alignment and first upside validation shelf
Type: Resistance Zone
Zone Range: 24920.00 – 24960.00
Comment: ETH high cluster and defended supply
Type: Support Zone
Zone Range: 24640.00 – 24620.00
Comment: Macro low alignment and defended ETH region
Type: Support Zone
Zone Range: 24500.00 – 24450.00
Comment: Broader continuation pocket if breakdown occurs
Type: Trigger Level
Level: 24840.00
Comment: Must be reclaimed for buyers to establish upward momentum
Bias Summary
Bias: Neutral-Defensive
Nearest Macro High: 24827.50
Nearest Macro Low: 24626.00
Validation Level: 24840.00
Trader Tip
Compression is not direction. It’s stored energy. The first expansion through a macro boundary often defines the dominant side for the entire session. Let the breakout confirm the narrative before committing.
NQ Flow Report
It all begins with an idea.
Monday, November 17, 2025
Yesterday’s RTH Recap
The RTH session traded between 25293.25 and 24627.00, with sellers maintaining control throughout the day. Price pushed steadily lower, breaking through multiple attempted intraday bases without meaningful response from buyers. The session closed near the lower boundary of the range, leaving the structure exposed to continued downside pressure.
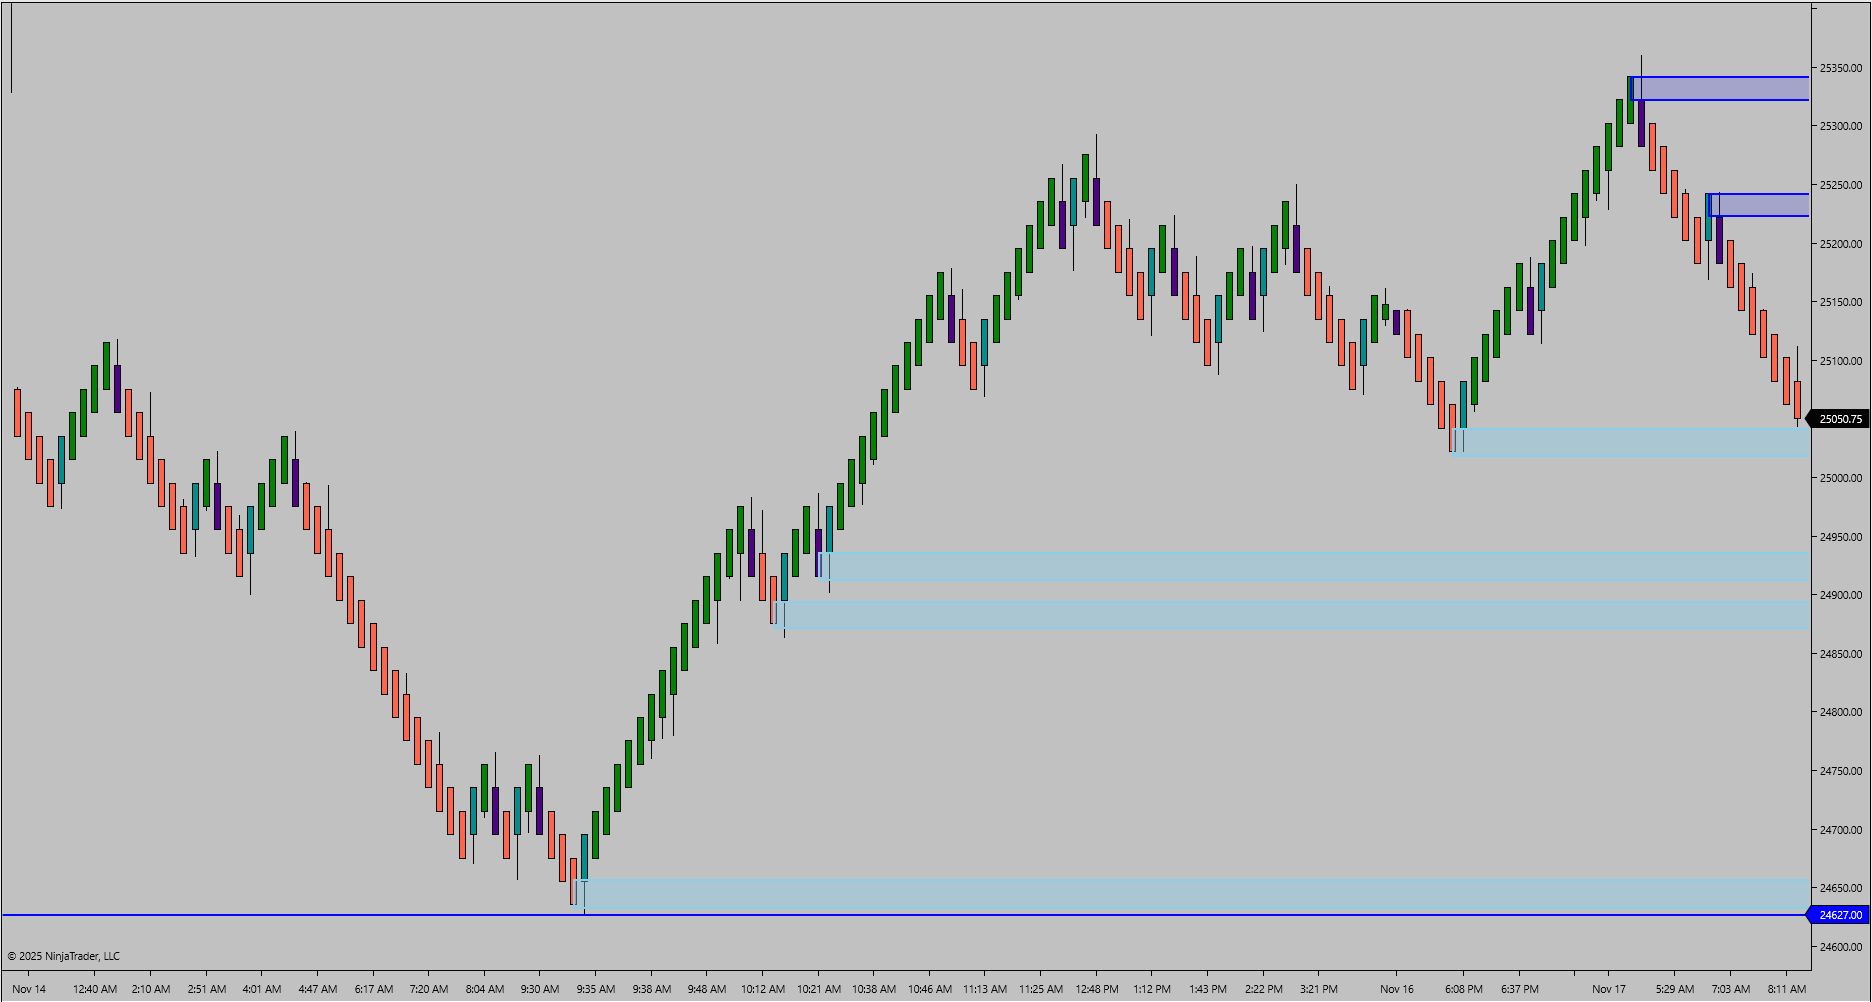
Figure 1 – RTH/ETH Structure Recap
Today’s ETH Framework
ETH extended the broader range overnight, printing a high of 25361.25 and a low of 25022.00.
The upper boundary aligns with the nearest macro structural high at 25342.00, creating a clean overhead reference for the session. Buyers defended 25022.00 during the overnight trade, a level matching the nearest macro structural low at 25023.25.
Price is currently rotating between these macro markers with no sustained acceptance in either direction.
News and Economic Events
No significant market reaction to today’s scheduled economic releases.
RTH Session Outlook
Structural Bias
Momentum on the intermediate and high timeframe layers is in compression, reflecting stabilization but not directional commitment. The macro layer shows mild upside expansion, offering early signs of strength yet not enough to override the broader downward structure from recent sessions.
Price continues to operate within the lower half of the macro range. Until buyers can establish and hold a higher base above nearby resistance zones, the overall tone for RTH remains defensively tilted.
Key Structural Levels
Resistance
• The most recent macro swing high forms the session’s immediate overhead reference.
• A secondary resistance band aligns with the ETH high region and a prior breakdown zone.
Support
• Primary support sits near yesterday’s RTH low.
• A broader support region extends into the zone tested throughout the overnight session.
Sellers retain control unless buyers can reclaim and sustain acceptance above the first overhead resistance band.
Trade Scenarios
Continuation Scenario – Seller Control
If price rotates into the first resistance band and fails to hold above it, the downside structure remains intact. A rejection from that area favors a move back toward lower support zones.
Buyers must defend above the first resistance zone to interrupt the prevailing tone.
Reversal Scenario – Support Engagement
A reversal attempt only activates if price retests the main support region and shows signs of stabilizing demand.
Should buyers establish a base and press through the nearby resistance zones, a broader rotation higher becomes possible.
Failure to stabilize within support keeps the downside narrative dominant.
Execution Notes
• Avoid chasing weak reactions into dense resistance areas.
• Intermediate and high timeframe compression suggests patience; wait for expansion before committing to direction.
• Strength above the overhead resistance band would serve as the earliest sign of recovery.
• A decisive break below the lower support region reaffirms the broader downside path.
Bias and Structure Outlook
The market remains inside a defined macro structure between 25342.00 and 25023.25.
ETH rejection at the upper boundary maintains a defensive tone unless buyers can secure acceptance above 25340.00.
A sustained move below 25020.00 exposes deeper continuation into the 24700–24600 region.
Current consolidation inside the macro band suggests the session may require a catalyst before choosing direction.
Key Levels
Resistance Zone
25340.00 – 25360.00
ETH high and macro structural alignment
Resistance Zone
25250.00 – 25290.00
RTH breakdown zone and overhead intraday cap
Support Zone
25040.00 – 25020.00
ETH defended low and nearest macro structural low
Support Zone
24700.00 – 24620.00
Broad RTH base and deeper continuation pocket
Trigger Level
25360.00
Acceptance required for upside continuation
Bias Summary
Bias: Defensive
Nearest Macro High: 25342.00
Nearest Macro Low: 25023.25
Validation Level: 25360.00
Trader Tip
When price rotates inside a macro band, wait for acceptance beyond the boundaries to confirm intent. Clean breakouts that hold beyond structural limits reduce noise and provide clarity on direction.
NQ Flow Report
It all begins with an idea.
Nasdaq Futures (Week of November 10–14, 2025)
Structural Context Summary
The Nasdaq futures market spent the week unwinding the prior rally and driving into a clear downside extension. Structure broke a series of lower highs and lower lows, completing a full rotation from the November 11 high at 25830.00 down into the 24626.00 macro low on November 14. The recovery into week-end pushed back toward mid-range, signaling the start of a potential balance phase rather than a confirmed directional shift.
Friday RTH Session Review
Friday’s session held the 24626.00 macro low after a clean downside exhaustion. Price climbed steadily throughout the session and into the close, reclaiming several intraday resistance points and finishing near 25147.50. This recovery established the first higher-low structure since November 12 and opens the door for early-week balance attempts.
Figure 1 – Weekly Structure Overview (Macro Chart)
Weekly Structure Overview
The week formed a defined descending structure:
25830.00 high → 25768.75 → 25761.00 → 25721.50 → 25488.75 → 25002.50 → 24626.00 low.
Each lower swing confirmed broad selling pressure until Friday’s recovery leg. The defense of the 24626.00 macro low sets the lower boundary for next week’s structure. The rebound into the 25100–25200 zone places price back inside the prior breakdown pocket, where buyers and sellers will contest control.
Key Structural Levels
Resistance Zone 25768.75 – 25830.00 – Weekly upper boundary and untested macro high
Resistance Zone 25488.75 – 25550.00 – Breakdown zone and prior swing rejection
Support Zone 25002.50 – 24900.00 – Mid-range support and recovery base
Support Zone 24626.00 – 24700.00 – Weekly exhaustion low and macro structural floor
Structural Milestones
Untested Weekly Structure High – 25830.00
Untested Weekly Structure Low – 24626.00
Validation Level – 25488.75
Continuation favored above validation; rotation expected below.
Next Week’s High Impact News
Wednesday – Housing Starts (8:30 ET)
Thursday – Existing Home Sales (10:00 ET)
Bias and Outlook
Bias – Neutral with upward validation at 25488.75
This week’s sharp decline followed by a clean late-week recovery puts the market into a balance-building phase. A sustained hold above 25488.75 would shift control back toward buyers and open a path toward 25721.50–25830.00. Failure to hold above 24900.00 would pull price back into the macro 24626.00 low.
Educational Insight / Trader Tip
The market reveals intent through how it responds to exhaustion lows. Strong recovery from a clean structural floor suggests a shift from liquidation to inventory rebuilding. The key is waiting for validation from reclaimed structure, not reacting to the first bounce.
Weekly Reflection
Structure resets through rotation. After a decisive liquidation leg, patience is required as the market chooses whether to rebuild momentum or re-test the extremes. Let structure confirm direction rather than anticipating it.
NQ Flow Report
It all begins with an idea.
Friday, November 14, 2025
Yesterday’s RTH Recap
Price continued its broader downside rotation, breaking below the prior RTH low and closing near session lows. Attempts to stabilize during mid-session were brief, and sellers regained control into the close.
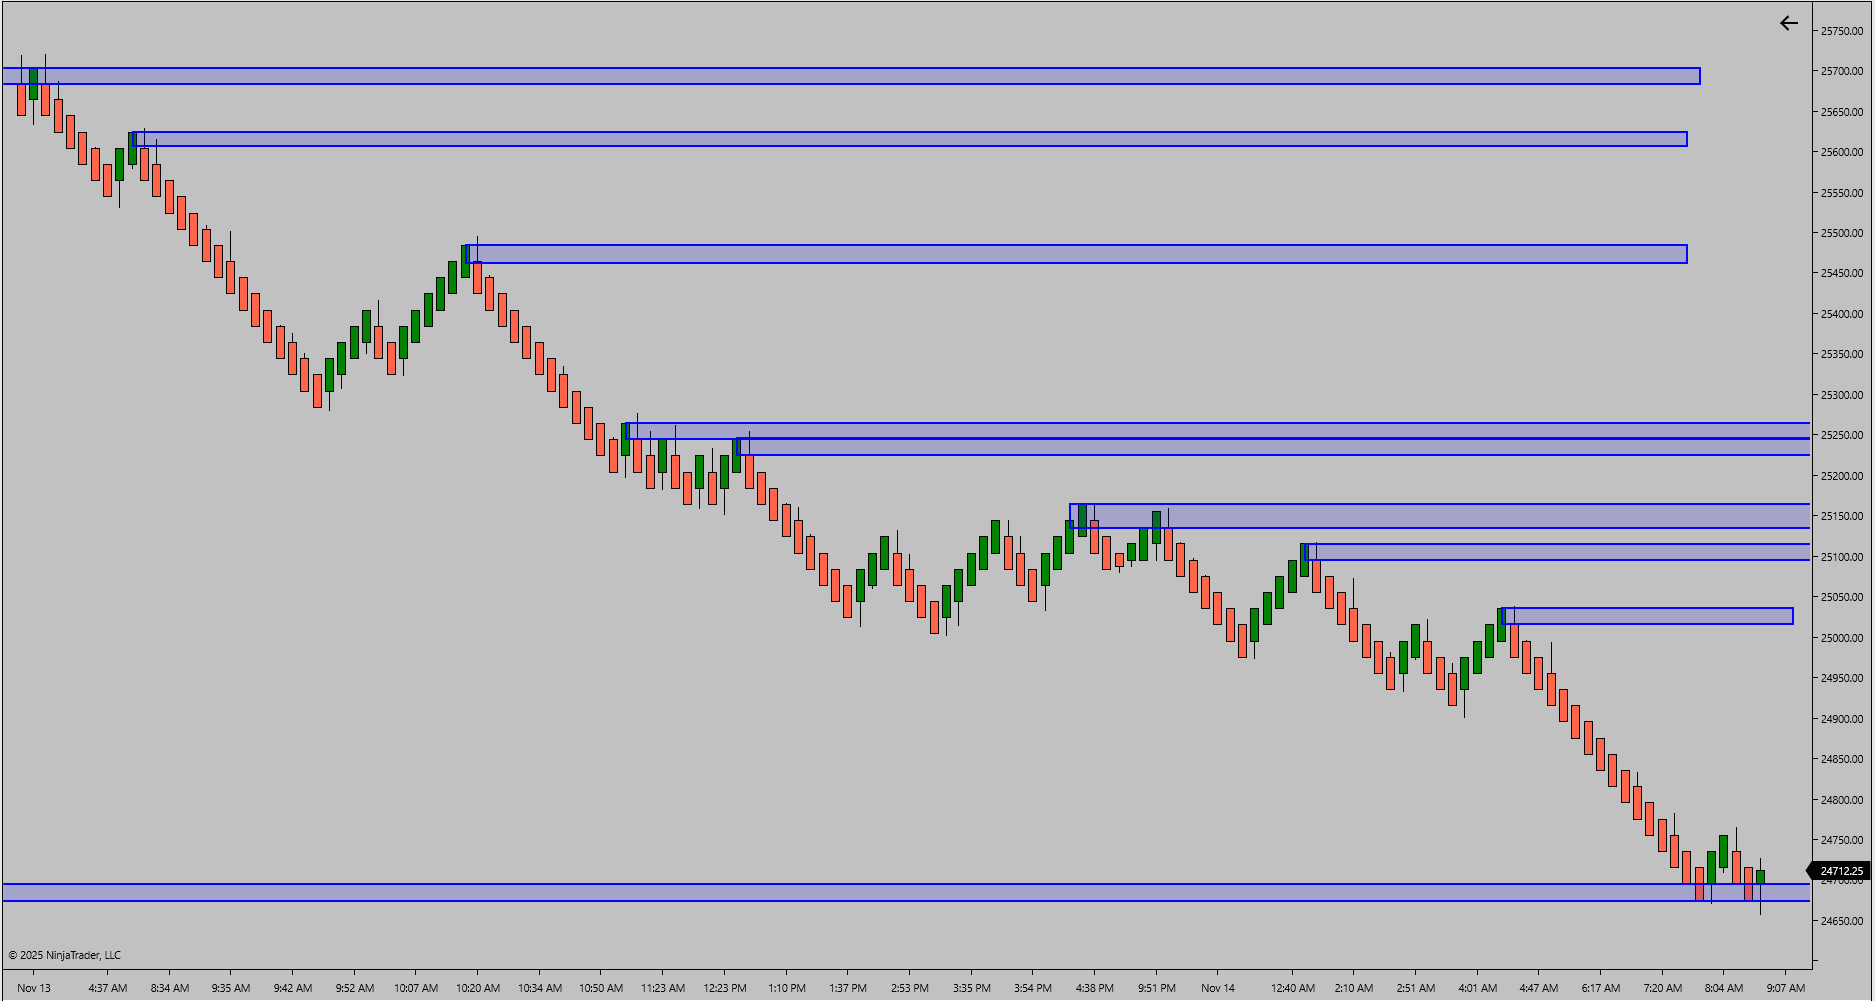
Figure 1 – RTH/ETH Structure Recap
Today’s ETH Framework
The overnight session extended the RTH weakness, pushing into a deeper structural low at 24670.50. A small reaction developed from that level, but no meaningful momentum shift formed. The ETH high at 25159.75 was rejected cleanly, reinforcing overhead supply.
News and Economic Events
There was minimal market response to this morning’s high impact news release.
Bias and Structure Outlook
The current structure favors continuation until buyers can reclaim and hold levels above the ETH distribution zone. The failure to generate a higher low suggests the downside sequence remains intact. Any intraday bounce faces stacked resistance layers from earlier breakdown points.
A sustained recovery above 25159.75 is required to shift the tone from defensive to neutral.
Key Levels
Type: Resistance Zone
Zone Range: 25140.00 – 25160.00
Comment: ETH rejection shelf and first structural test for buyers
Type: Resistance Zone
Zone Range: 25300.00 – 25340.00
Comment: Breakdown retest area from early RTH
Type: Support Zone
Zone Range: 24700.00 – 24650.00
Comment: Overnight structural low and current failure point
Type: Support Zone
Zone Range: 25020.00 – 24980.00
Comment: Prior RTH low and continuation pivot
Type: Trigger Level
Zone Range: 25160.00
Comment: Must be reclaimed to neutralize immediate downside pressure
Bias Summary
The market remains defensive with sellers holding control below the ETH rejection zone. Upside attempts face layered resistance, while failure to stabilize above 25000.00 exposes deeper continuation risk.
Trader Tip
Continuation moves break only when the market proves it can build higher lows. Do not assume strength simply because price bounces. Track the reclaim levels and wait for structure to confirm the shift.
NQ Flow Report
It all begins with an idea.
Thursday, November 13, 2025
Yesterday’s RTH Recap
Price opened inside prior structure and held a wide rotational range through most of the session. Attempts to lift toward upper resistance failed, and sellers pushed the market back into the center of Tuesday’s structure. RTH closed inside a broad consolidation band with no directional follow-through.
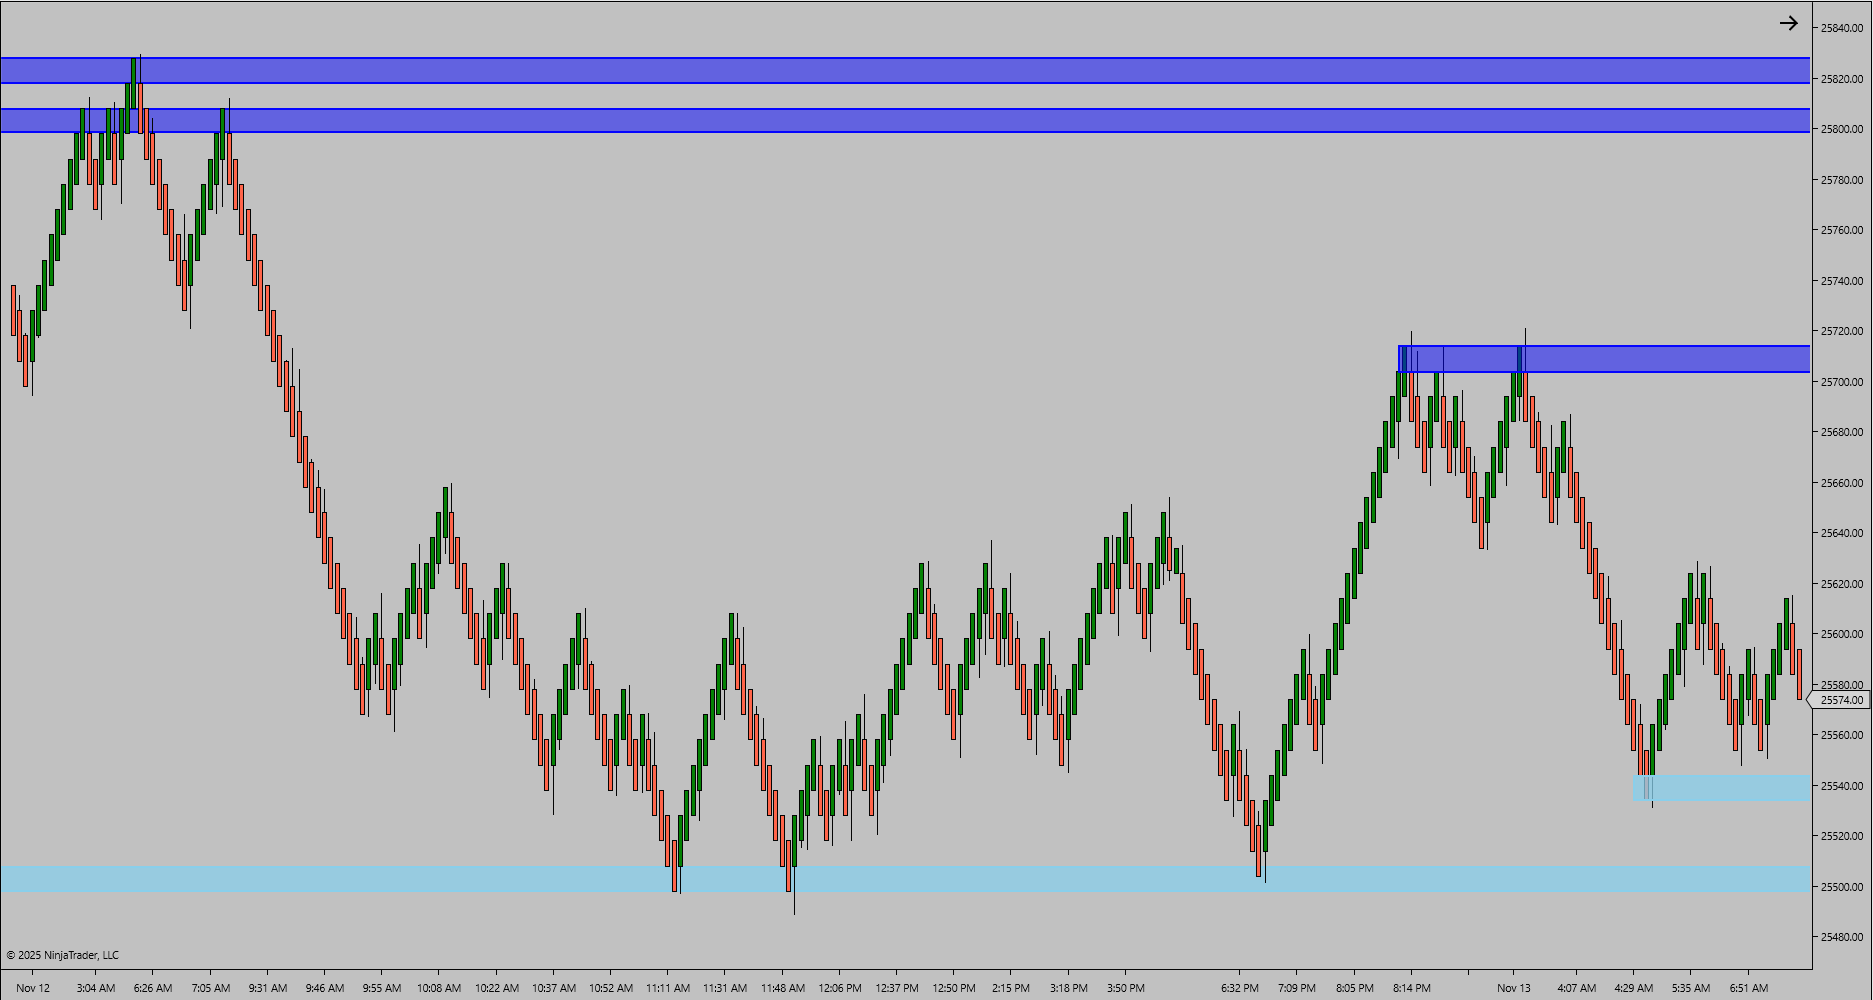
Figure 1 – RTH/ETH Structure Recap
Today’s ETH Framework
ETH traded between 25721.50 and 25501.50, holding inside yesterday’s mid-range. Buyers defended the 25500 pocket, while sellers capped every rotation into 25700. Tone remains balanced with neither side establishing control.
News and Economic Events
There was no meaningful reaction to today’s high-impact release. Structure remains the primary driver.
Bias and Structure Outlook
Bias remains neutral until price accepts above 25720 or breaks back below 25500. Continuation requires a clean move through upper resistance, while failure to hold 25500 opens the door for renewed rotation lower.
Key Levels
Type: Resistance Zone
Zone Range: 25700.00 – 25730.00
Comment: Repeated ETH rejection cluster near upper band
Type: Resistance Zone
Zone Range: 25810.00 – 25830.00
Comment: RTH high and upper rejection zone
Type: Support Zone
Zone Range: 25500.00 – 25480.00
Comment: Active ETH/RTH demand pocket
Type: Support Zone
Zone Range: 25450.00 – 25390.00
Comment: Lower structural defense from Tuesday’s rotation
Type: Trigger Level
Zone Range: 25720.00
Comment: Validation level required for continuation upward
Bias Summary
Untested HTF Structure High – 25830.00
Untested HTF Structure Low – 25488.75
Validation Level – 25720.00
Session Energy Summary – Neutral
Continuation favored above validation; rotation expected below.
Trader Tip
When price compresses inside prior structure, let the market declare direction. Acceptance through resistance signals continuation, while defense at support confirms rotation.
NQ Flow Report
It all begins with an idea.
Wednesday, November 12, 2025
Yesterday’s RTH Recap
The RTH session opened near 25500 and expanded steadily to a high of 25768.75 before consolidating. Buyers regained control after defending 25478.50, reclaiming the prior structural zone and sustaining momentum through the upper resistance band. The recovery confirmed a shift back into continuation structure following Monday’s controlled pullback.
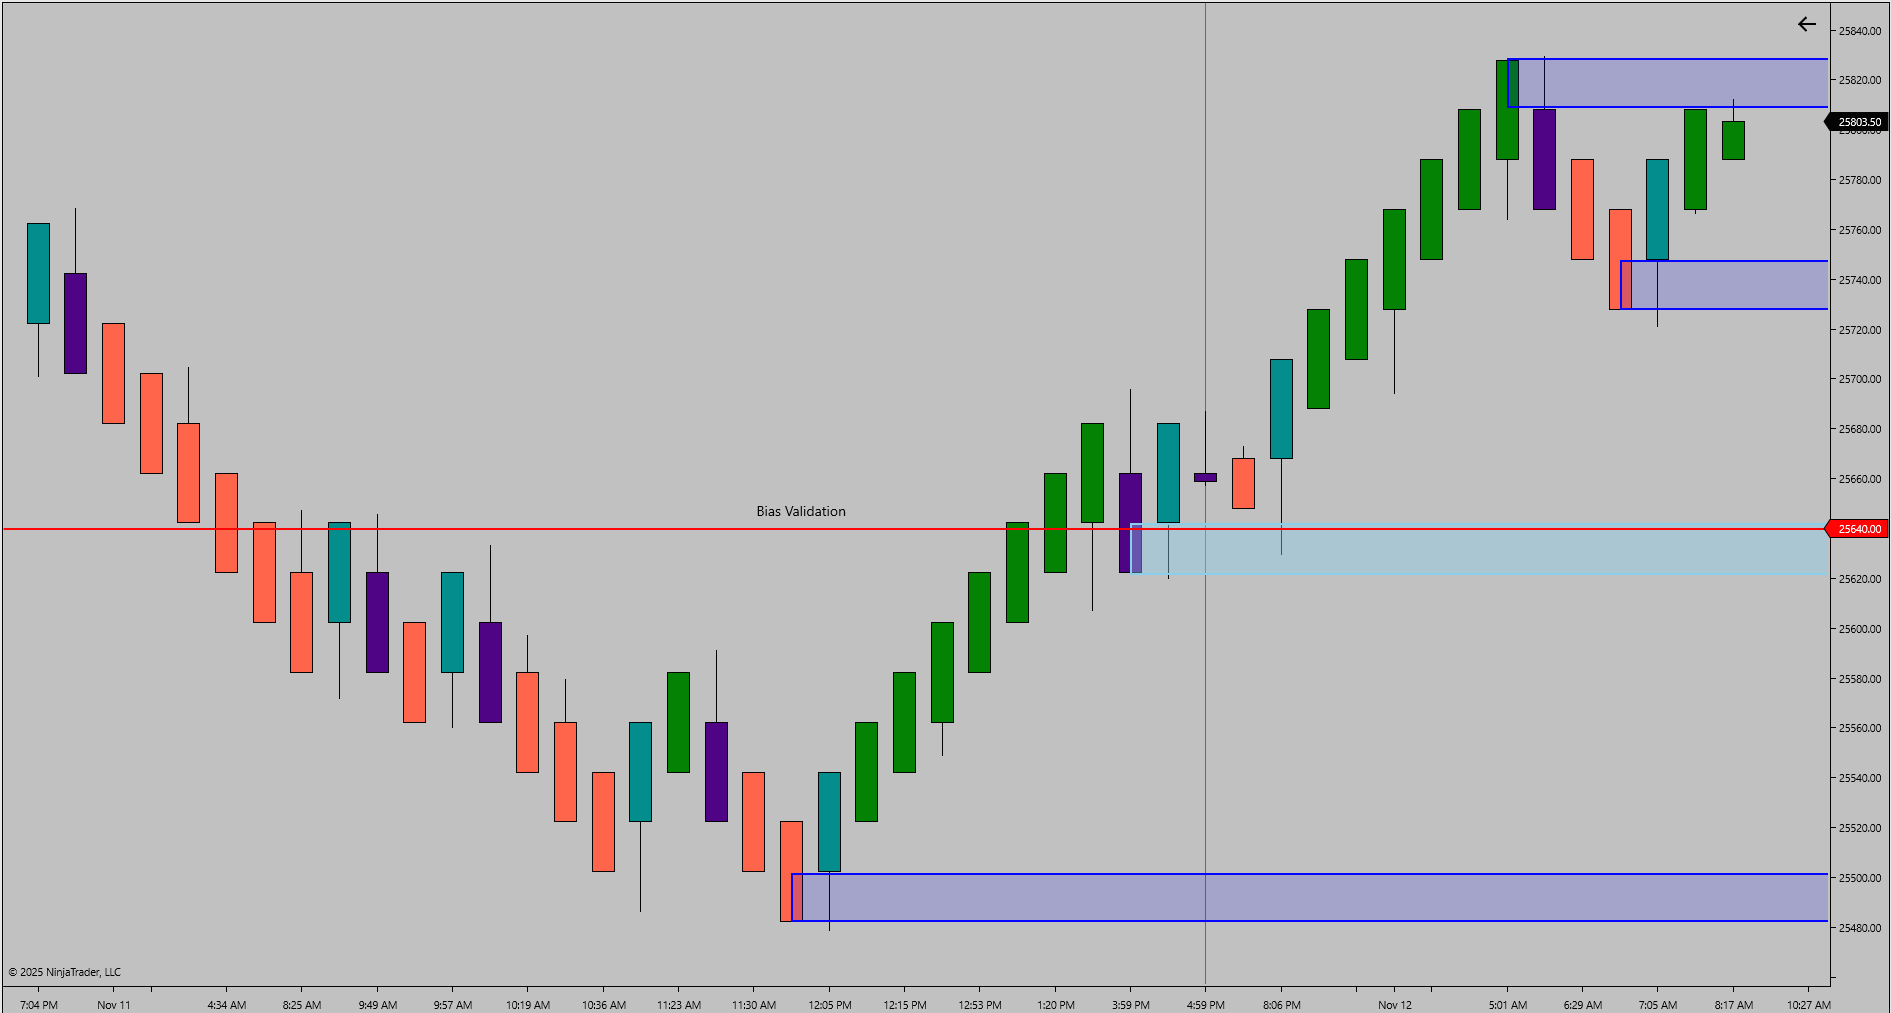
Figure 1 – RTH/ETH Structure Recap
Today’s ETH Framework
Overnight structure extended modestly higher, reaching 25830.00 before rotating down toward 25629.50. Price remains inside an upper consolidation channel, holding above the reclaimed 25600 support zone. Continuation bias remains active while structure stays elevated within this range, with resistance overhead near 25820–25840.
News and Economic Events
No high-impact U.S. economic news is scheduled for today.
Bias and Structure Outlook
Momentum context favors a bullish continuation while price remains above 25600. A clean expansion through 25840 would confirm renewed trend strength targeting 25900–25950. Below 25600, structure could rotate into a mid-session balance zone between 25500–25450 before new directional commitment appears.
Key Levels
Type: Resistance Zone
Zone Range: 25820.00 – 25840.00
Comment: ETH upper consolidation ceiling and near-term rejection area
Type: Support Zone
Zone Range: 25600.00 – 25550.00
Comment: Active structural base with repeated intraday defense
Type: Support Zone
Zone Range: 25450.00 – 25400.00
Comment: Lower liquidity shelf and prior RTH reaction base
Type: Trigger Level
Zone Range: 25840.00
Comment: Breakout validation threshold for directional continuation
Bias Summary
Bias: Bullish while above 25600
Trader Tip
When structure consolidates near prior highs, focus on reaction quality rather than price alone. A strong breakout is confirmed not by the breakout candle itself but by how efficiently pullbacks are absorbed afterward. Strength reveals itself through quick recoveries, not just fast moves.
NQ Flow Report
It all begins with an idea.
Tuesday, November 11, 2025
Yesterday’s RTH Recap
The RTH session formed a controlled advance from 25452.00 to 25760.50 before consolidating into the close. Buyers defended the 25500 zone early in the session and maintained upward control throughout, completing a clean extension leg after Monday’s continuation rally.
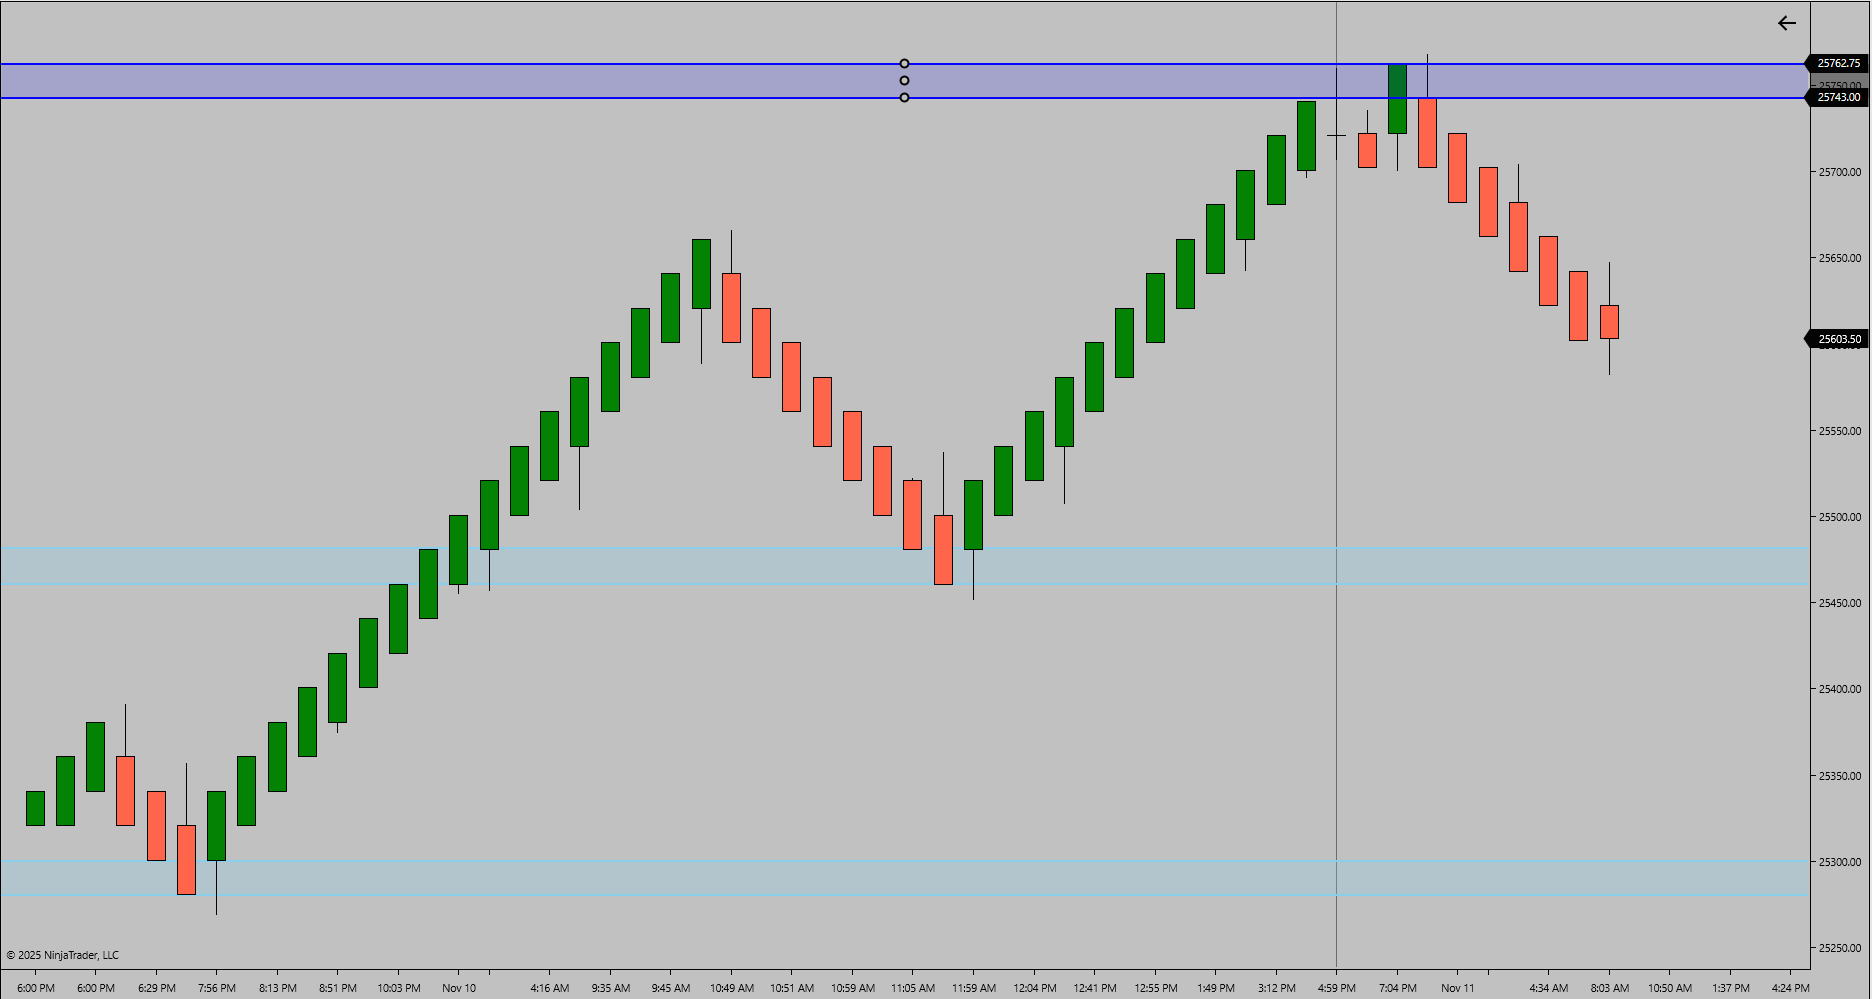
Figure 1 – RTH/ETH Structure Recap
Today’s ETH Framework
Overnight trade extended slightly above the RTH high to 25768.75 before pulling back to 25582.25. The session has shown limited volatility, consolidating just below the upper resistance band near 25750. Short-term behavior reflects pause within a broader continuation structure, as buyers attempt to defend higher lows without fresh breakout energy.
News and Economic Events
No high-impact U.S. economic news is scheduled for today.
Bias and Structure Outlook
Current structure favors a neutral-to-bullish stance while above 25550. A confirmed breakout through 25770 could reestablish continuation momentum toward 25850–25900. Failure to hold above 25550 may lead to a controlled rotation back toward 25450 or the deeper 25350 zone for support testing.
Bias Summary
Bias: Neutral-to-Bullish within consolidation
Key Levels:
• 25770 – Upper resistance trigger zone
• 25550 – Structural support
• 25450 – Lower test zone
Key Levels
Type: Resistance Zone
Zone Range: 25740.00 – 25770.00
Comment: Active upper band resistance from ETH session
Type: Support Zone
Zone Range: 25550.00 – 25580.00
Comment: Active intraday defense and structural equilibrium pocket
Type: Support Zone
Zone Range: 25450.00 – 25350.00
Comment: Deep test zone aligning with prior RTH consolidation base
Type: Trigger Level
Zone Range: 25770.00
Comment: Validation threshold for continuation breakout
Trader Tip
When momentum stalls near resistance, observe how structure reclaims control. A brief pause or small retrace can often recharge the trend. Discipline lies in waiting for validation — patience in consolidation defines strength in expansion.
NQ Flow Report
It all begins with an idea.
Monday, November 10, 2025
Yesterday’s RTH Recap
Friday’s RTH session printed a strong expansion from 24709.25 to 25354.75 after reclaiming the prior structural base. Buyers maintained control through multiple intraday rotations, leading into a decisive close near upper resistance. This renewed momentum defined a clear shift in structural rhythm heading into the new week.
Figure 1 – RTH/ETH Structure Recap
Today’s ETH Framework
Overnight ETH continued the upward sequence, extending to 25569.50 before encountering early-session resistance. The lower boundary at 25269.00 now represents active intraday support. This continuation has filled the remaining pocket from last week’s RTH range, completing a full recovery leg into prior resistance.
News and Economic Events
No high-impact economic events are scheduled for today. Market rhythm is expected to follow structural behavior without external catalysts
Bias and Structure Outlook
Bias – Bullish with Caution.
Price is currently interacting with overhead resistance near 25550–25570. Sustained acceptance above this area would confirm structural continuation and open potential for new expansion highs. A rejection, however, could trigger the first controlled pullback into the 25300–25250 range, which aligns with the short-term equilibrium zone.
Key Levels
Type: Resistance Zone
Zone Range: 25550.00 – 25570.00
Comment: Active ETH rejection cluster
Type: Support Zone
Zone Range: 25300.00 – 25250.00
Comment: Short-term equilibrium and potential re-entry base
Type: Support Zone
Zone Range: 25000.00 – 24700.00
Comment: Prior structural demand base and defended RTH low
Type: Trigger Level
Zone Range: 25570.00
Comment: Structural validation for continuation
Bias Summary
RTH High – 25354.75
RTH Low – 24709.25
ETH High – 25569.50
ETH Low – 25269.00
Current structure favors bullish continuation with a potential early pullback into support zones before directional confirmation.
Trader Tip
After strong expansion days, structural rhythm often compresses before the next directional leg. Avoid chasing new highs during early consolidation. Instead, focus on how price behaves around prior support zones—continuation strength comes from controlled pullbacks, not spikes.
NQ Flow Report
It all begins with an idea.
Weekly Market Structure Outlook – Nasdaq Futures (Week of November 3–7, 2025)
Structural Context Summary
The Nasdaq futures market completed a significant corrective leg last week, retracing beyond the 78.6% of its October 17 impulse before stabilizing. Price structure has now transitioned from broad rotation into a potential base-building phase. Buyers reclaimed control late in the week from the 24709.25 low, forming the foundation for early-week balance or continuation attempts.
Friday RTH Session Review
Friday’s RTH session held higher lows through midday and closed with firm upward rhythm, defending 25050–25100 as structural support. The session ended near 25226.75, marking the first constructive higher low since the November 5 exhaustion break.
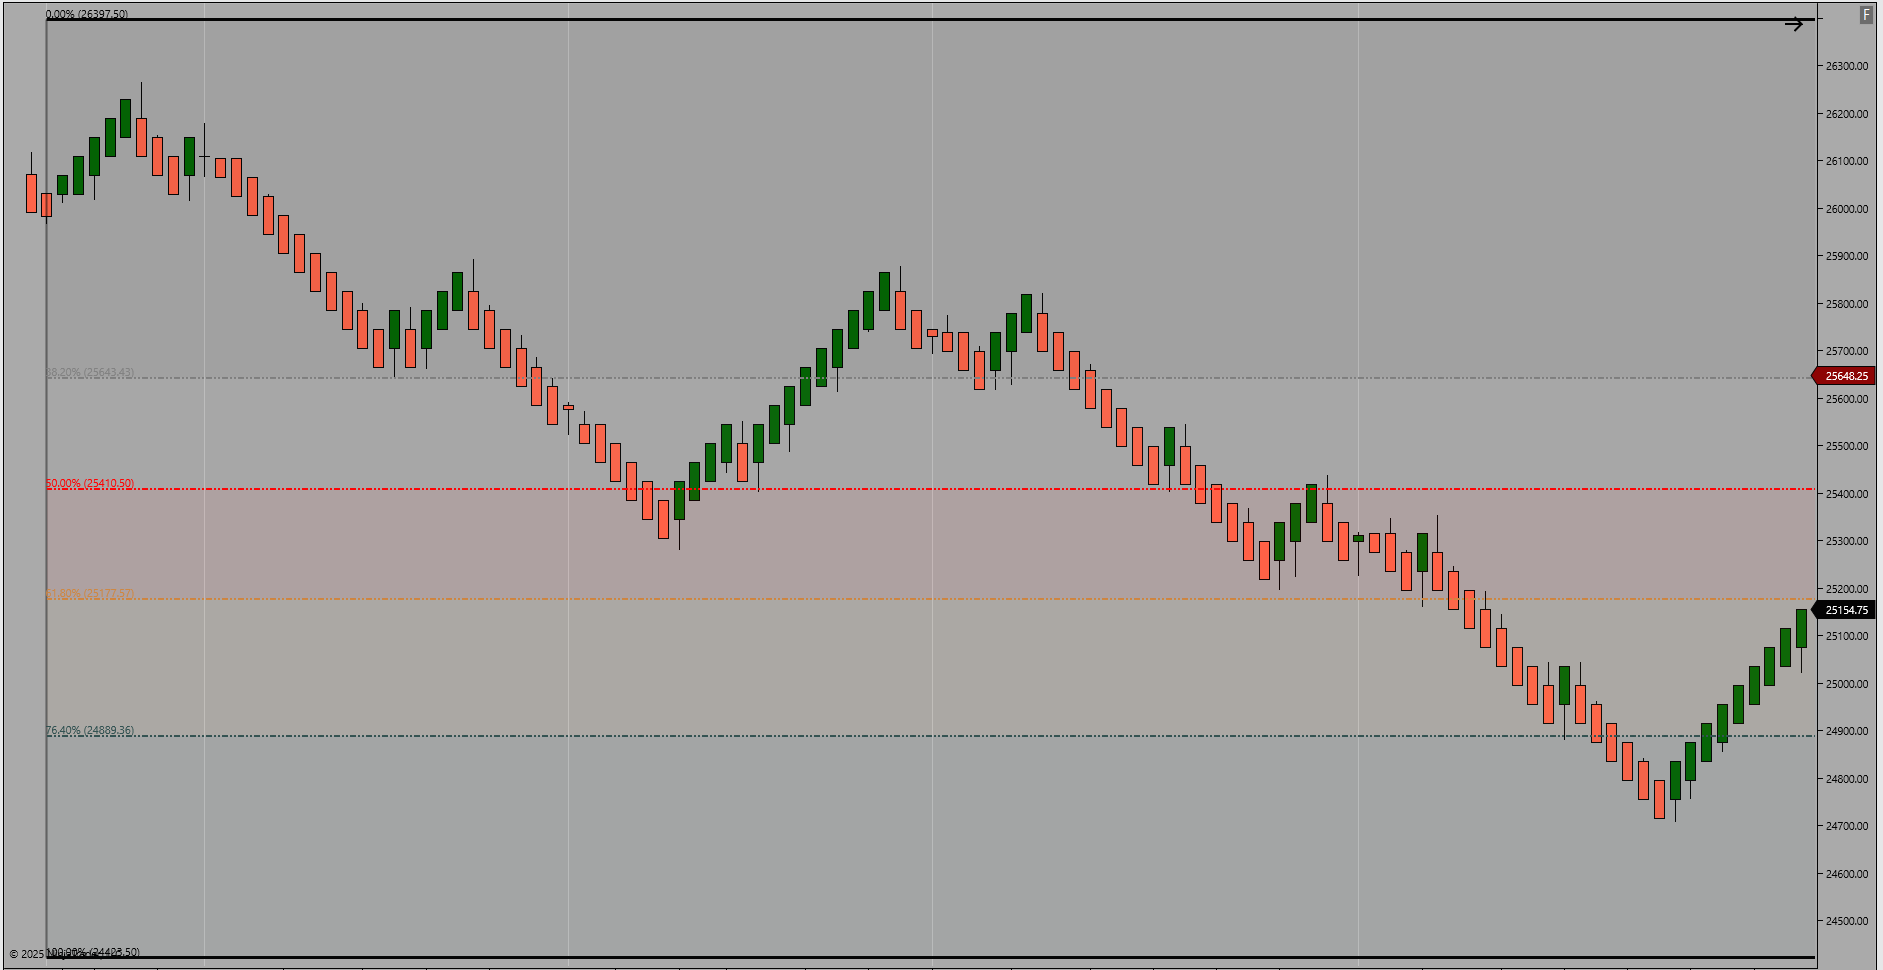
Figure 1 – Weekly Structure with Fibonacci Pullback Context
Weekly Structure Overview
The retracement from the October 17 low (24430.50) to the 26266.00 high completed a deep pullback beyond the 78.6% level before showing signs of absorption. This deeper-than-expected retracement suggests reaccumulation rather than sustained trend failure. Structure remains inside the broader expansion leg, with short-term rotation occurring within a high-time-frame control zone.
Retracement Context (Fibonacci)
The pullback extended through 61.8% (25181.00) and briefly below 78.6% (24846.00) before rebounding. The recovery into the 25200–25300 zone indicates that demand remains active near prior structural balance. Sustained acceptance above the 50% midpoint at 25414.00 would confirm renewed directional intent.
Key Structural Levels
Resistance Zone 25648.25 – 25700.00 – Upper balance cap and reaction zone
Resistance Zone 25414.00 – 25480.00 – Fibonacci midpoint and validation area
Support Zone 25200.00 – 25150.00 – Recent RTH defended structure
Support Zone 24900.00 – 24700.00 – Macro base and exhaustion low
Structural Milestones
Untested Weekly Structure High – 26266.00
Untested Weekly Structure Low – 24709.25
Validation Level – 25414.00
Continuation favored above validation; rotation expected below.
Next Week’s High Impact News
Thursday - Core Inflation Rate (08:30 ET)
Friday – Retail Sales, PPI (08:30 ET)
Bias and Outlook
Bias – Neutral-to-Bullish (Validation 25414.00)
The week begins within a high compression field. Continuation above 25414.00 opens a path toward 25650–25700. Failure below 25150.00 reintroduces rotational pressure into the 24900–24700 base.
Educational Insight / Trader Tip
When structure retraces deeper than expected yet maintains pattern integrity, it reflects energy absorption — not weakness. True reversals only confirm when reclaimed levels fail to defend.
Weekly Reflection
Strength is built through structure that survives compression. The disciplined trader recognizes deep retracements as potential reloading zones, not invalidations, when higher-frame structure remains intact.
NQ Flow Report
It all begins with an idea.
Friday, November 7, 2025
Yesterday’s RTH Recap
Thursday’s RTH session ranged between 25822.25 and 25197.75. Price extended the prior downtrend, with multiple attempts to stabilize inside lower structural support that ultimately failed to reclaim momentum. Sellers maintained control throughout the session, closing near the lower boundary of the day’s range.
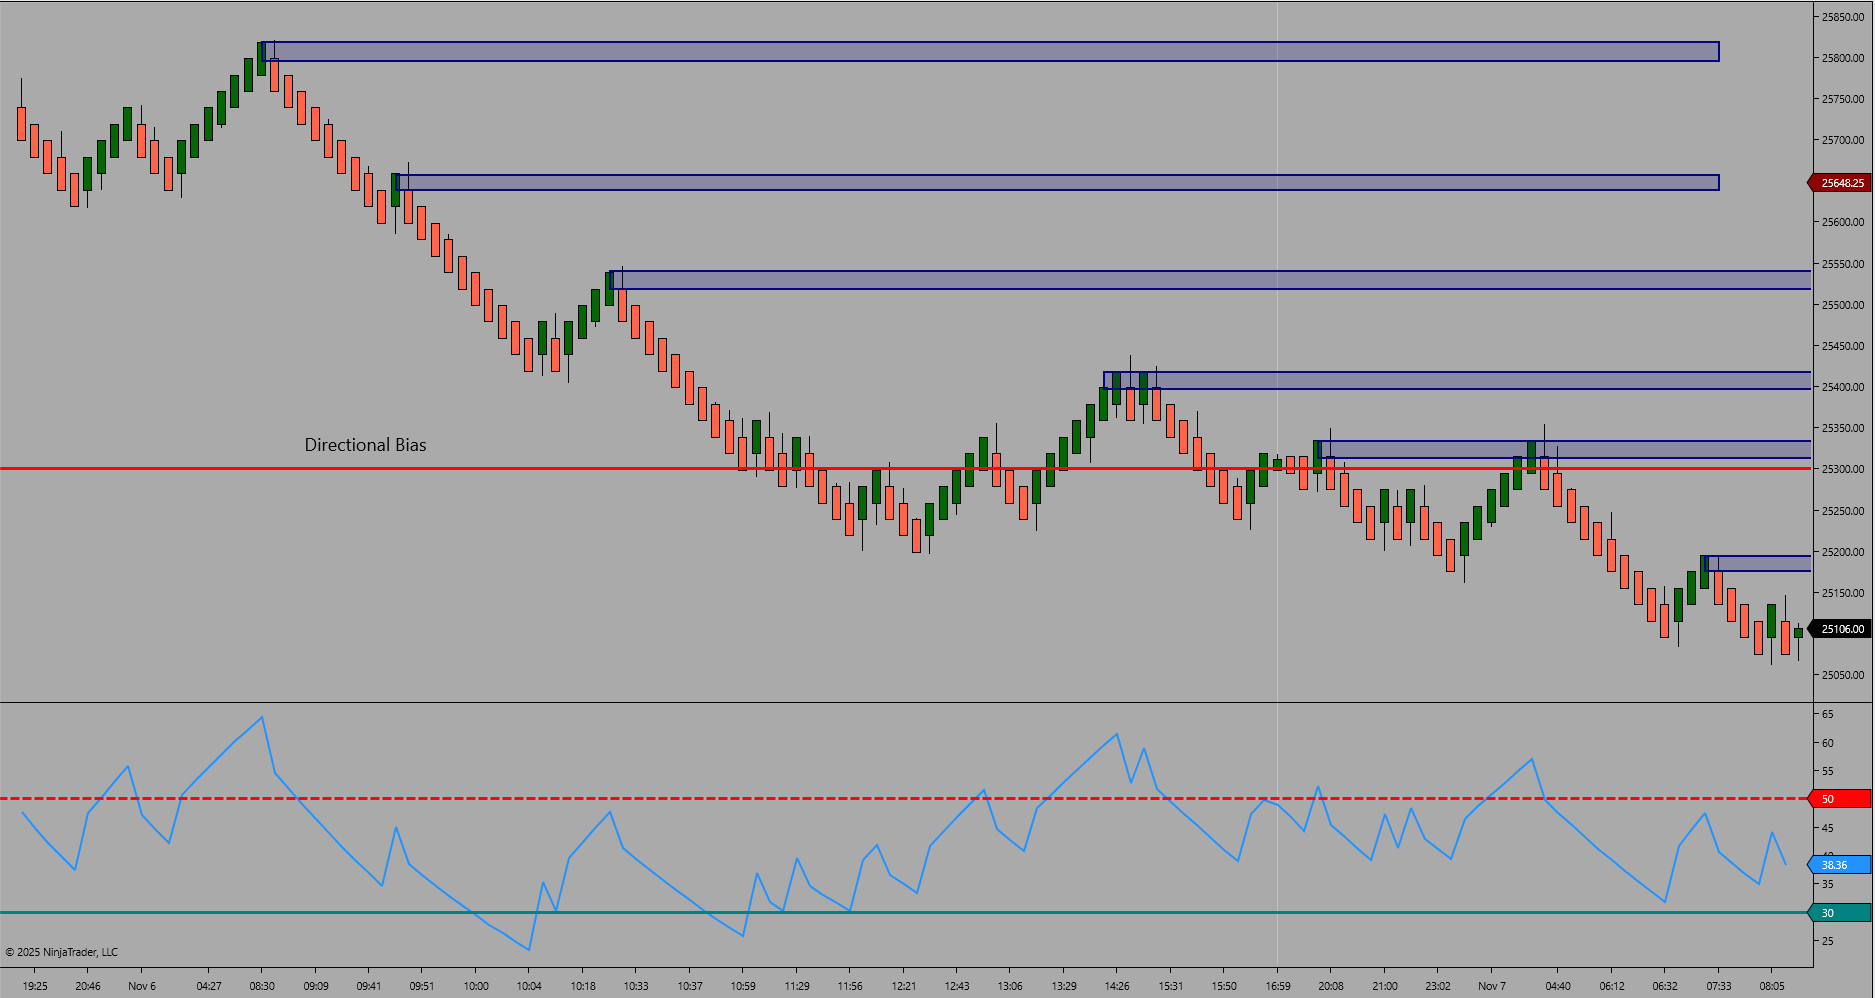
Figure 1 – RTH/ETH Structure Recap
Today’s ETH Framework
Overnight ETH activity continued the decline, printing a high of 25354.75 and a low of 25067.75. Price is now trading near the edge of the prior macro base, where 24937.00 remains the next structural low to monitor. The ETH profile shows a slow, controlled descent, indicating continuation pressure unless buyers defend within the current zone.
Bias and Structure Outlook
Bias – Bearish with Caution.
Momentum remains weak across the structure, with sellers maintaining advantage below 25300. A recovery above this zone would be the first sign of structure reclaim. If 25050.00 breaks, continuation toward the 24937.00 macro low becomes increasingly probable.
Key Levels
Type: Resistance Zone
Zone Range: 25300.00 – 25350.00
Comment: Upper ETH rejection cluster and short-term cap
Type: Support Zone
Zone Range: 25050.00 – 24950.00
Comment: Active macro support and potential rebound base
Type: Trigger Level
Zone Range: 25300.00
Comment: Structural validation threshold for short-term reversal attempts
Bias Summary
Untested HTF Structure High – 25354.75
Untested HTF Structure Low – 24937.00
Validation Level – 25300.00
Continuation lower remains favored while below validation; reclaiming above 25300.00 would neutralize the bearish sequence.
Trader Tip
Momentum exhaustion rarely resolves instantly—wait for a full reclaim above validation before assuming structure shift.
NQ Flow Report
It all begins with an idea.
Thursday, November 6, 2025
Yesterday’s RTH Recap
Wednesday’s RTH session traded between 25880.00 and 25617.25, continuing a slow structural climb after the prior day’s compression. Price retested the lower demand area before reclaiming control into the midrange. The session held higher lows and built a small structural base above 25650.00, confirming early signs of stabilization.
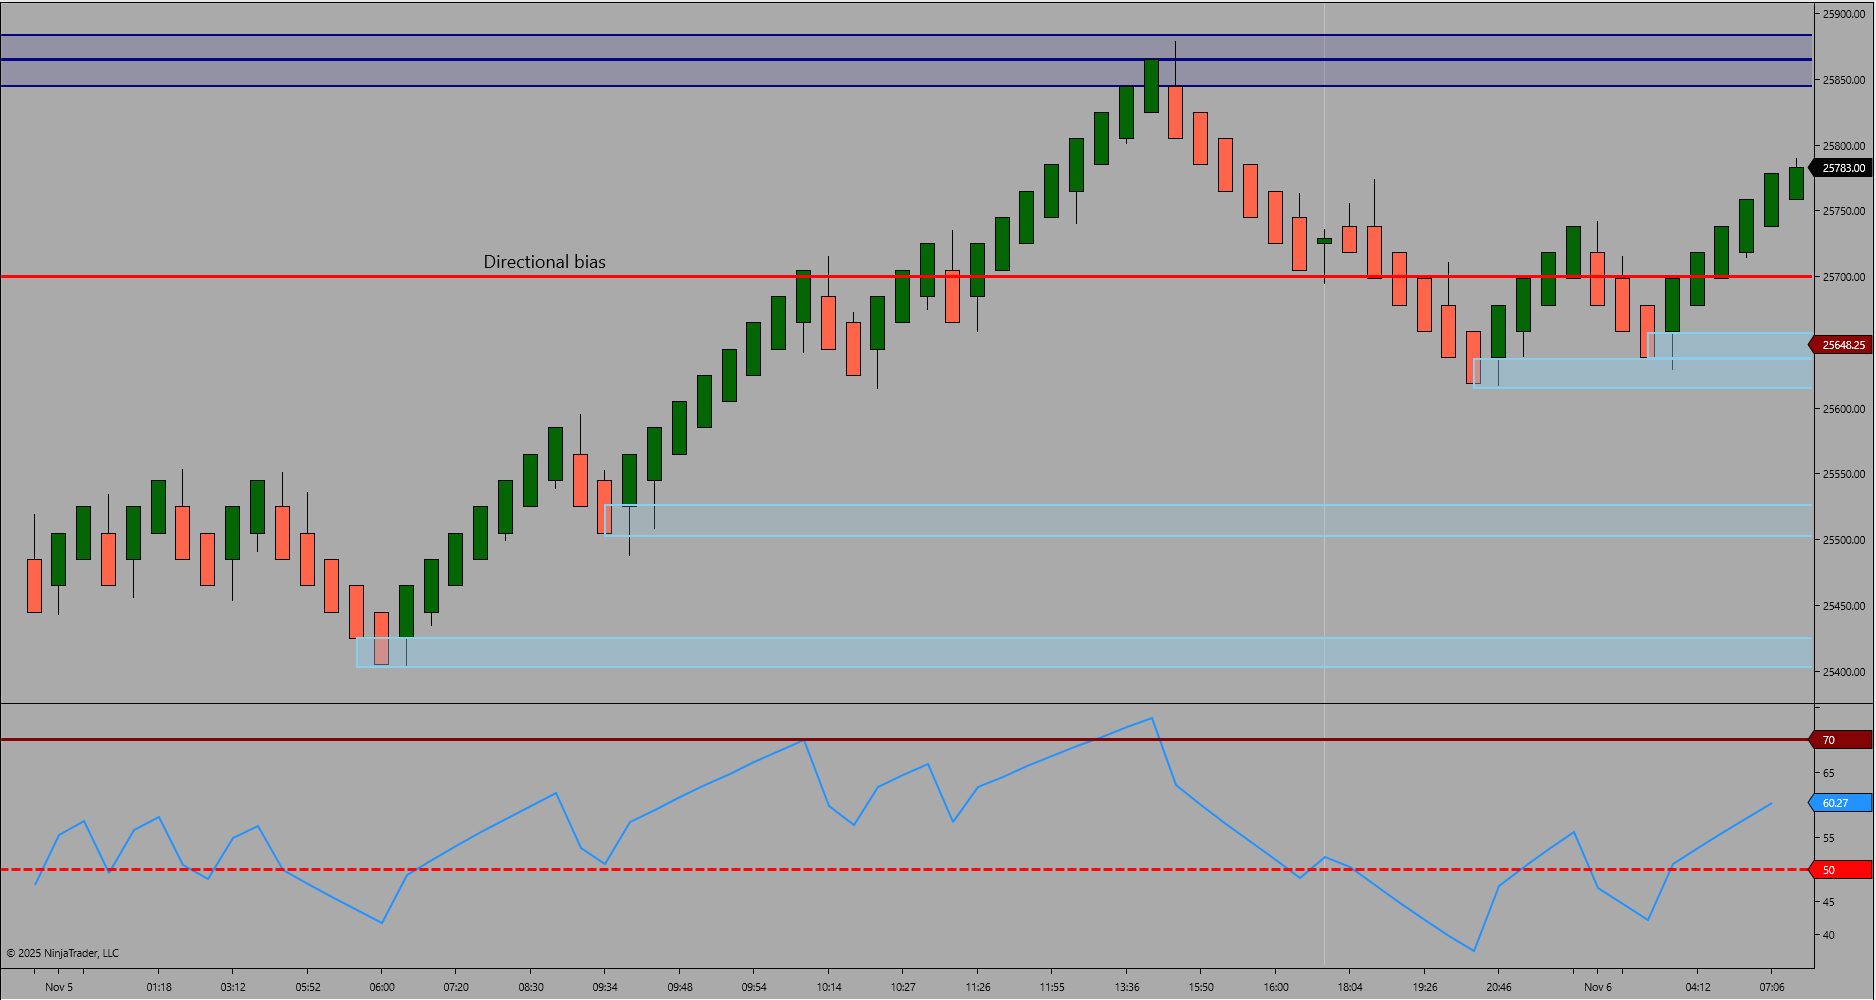
Figure 1 – RTH/ETH Structure Recap
Today’s ETH Framework
Overnight ETH trade extended within a contained structure, printing a high of 25791.00 and a low of 25404.00. The ETH range has narrowed as price consolidates near midstructure, with buyers defending the lower 25500.00 zone. The prior RTH high at 25880.00 remains the key upside reference for directional expansion if continuation strength develops.
Bias and Structure Outlook
Bias – Neutral to Bullish.
The framework supports a developing base after recent downside exhaustion. A sustained bid above 25700.00 can confirm control and open a test of 25850.00–25880.00, while failure to hold 25500.00 would signal renewed pressure back into the lower structural pocket.
Key Levels
Type: Resistance Zone
Zone Range: 25850.00 – 25880.00
Comment: RTH structural cap and current upside validation
Type: Support Zone
Zone Range: 25500.00 – 25400.00
Comment: Active ETH base with repeated defense
Type: Trigger Level
Zone Range: 25700.00
Comment: Midstructure control point for continuation or rejection
Bias Summary
Untested HTF Structure High – 25880.00
Untested HTF Structure Low – 25404.00
Validation Level – 25700.00
Continuation higher favored while above validation. Breakdown through 25500.00 reopens lower rotation.
Trader Tip
Momentum reclaims often begin quietly—watch the reaction around 25700.00 for confirmation of control transfer before chasing directional expansion.
NQ Flow Report
It all begins with an idea.
Wednesday, November 5, 2025
Yesterday’s RTH Recap
Tuesday’s RTH session traded between 25893.50 and 25642.25, holding a controlled downward tone within an established bearish leg. Price attempted to reclaim midrange control early in the session but failed to sustain above 25850.00, resulting in a steady continuation lower into the close. The session confirmed structure alignment with the broader 160-frame momentum, which remains under compression.
Figure 1 – RTH/ETH Structure Recap
Today’s ETH Framework
Overnight ETH trade extended the lower structural range, printing a high of 25554.00 and a low of 25404.00. The narrow ETH range reflects ongoing contraction after Monday’s gap down, with price remaining inside the lower half of the broader leg. The prior ETH high of 25975.75 remains untested and defines the upper reference for any recovery attempt. Price is stabilizing near the lower end of the structure but continues to trade below the 25700.00 validation threshold.
Bias and Structure Outlook
Bias – Bearish with validation at 25700.00.
Continuation lower is favored while price remains below 25700.00. A sustained break above 25700.00 would shift tone to neutral and open rotation toward 25850.00. Current conditions remain range-bound beneath resistance, with momentum still contracting within a bearish framework.
Fibonacci Context
The current Fibonacci retracement drawn from 25975.75 to 25404.00 outlines the active retracement window for today’s session. The 38.2% retracement near 25630.00 and the 50% midpoint at 25690.00 align closely with the lower resistance zone, forming the initial reaction band for sellers. The 61.8% retracement at 25750.00 represents the upper pivot where structure would likely determine continuation or reversal. Holding below the 50%–61.8% cluster confirms bearish control, while a full reclaim through 25750.00 would indicate recovery toward prior session midrange.
Key Levels
Type: Resistance Zone
Zone Range: 25690.00 – 25750.00
Comment: Active Fibonacci retracement and short-term control band
Type: Resistance Zone
Zone Range: 25850.00 – 25890.00
Comment: Prior RTH rejection zone
Type: Support Zone
Zone Range: 25500.00 – 25400.00
Comment: ETH structural base and defended demand
Type: Trigger Level
Zone Range: 25700.00
Comment: Validation threshold for continuation or rotation
Bias Summary
Untested HTF Structure High – 25975.75
Untested HTF Structure Low – 25404.00
Validation Level – 25700.00
Continuation favored while price remains below validation; rotation expected above.
Trader Tip
Fibonacci retracement clusters often mark the shift between reactive pullbacks and true reversals—watch for compression or rejection at 25700.00 to define today’s directional control.
NQ Flow Report
It all begins with an idea.
Flow Report – Tuesday, November 4, 2025
Yesterday’s RTH Recap
Monday’s RTH session advanced through 26012.75 to 26266.00 before closing at 26131.00. Price built a steady upward sequence through the early session but lost momentum late in the day, closing just below resistance. The structure remained elevated, but energy began compressing into the close, setting up for a potential overnight shift in control.
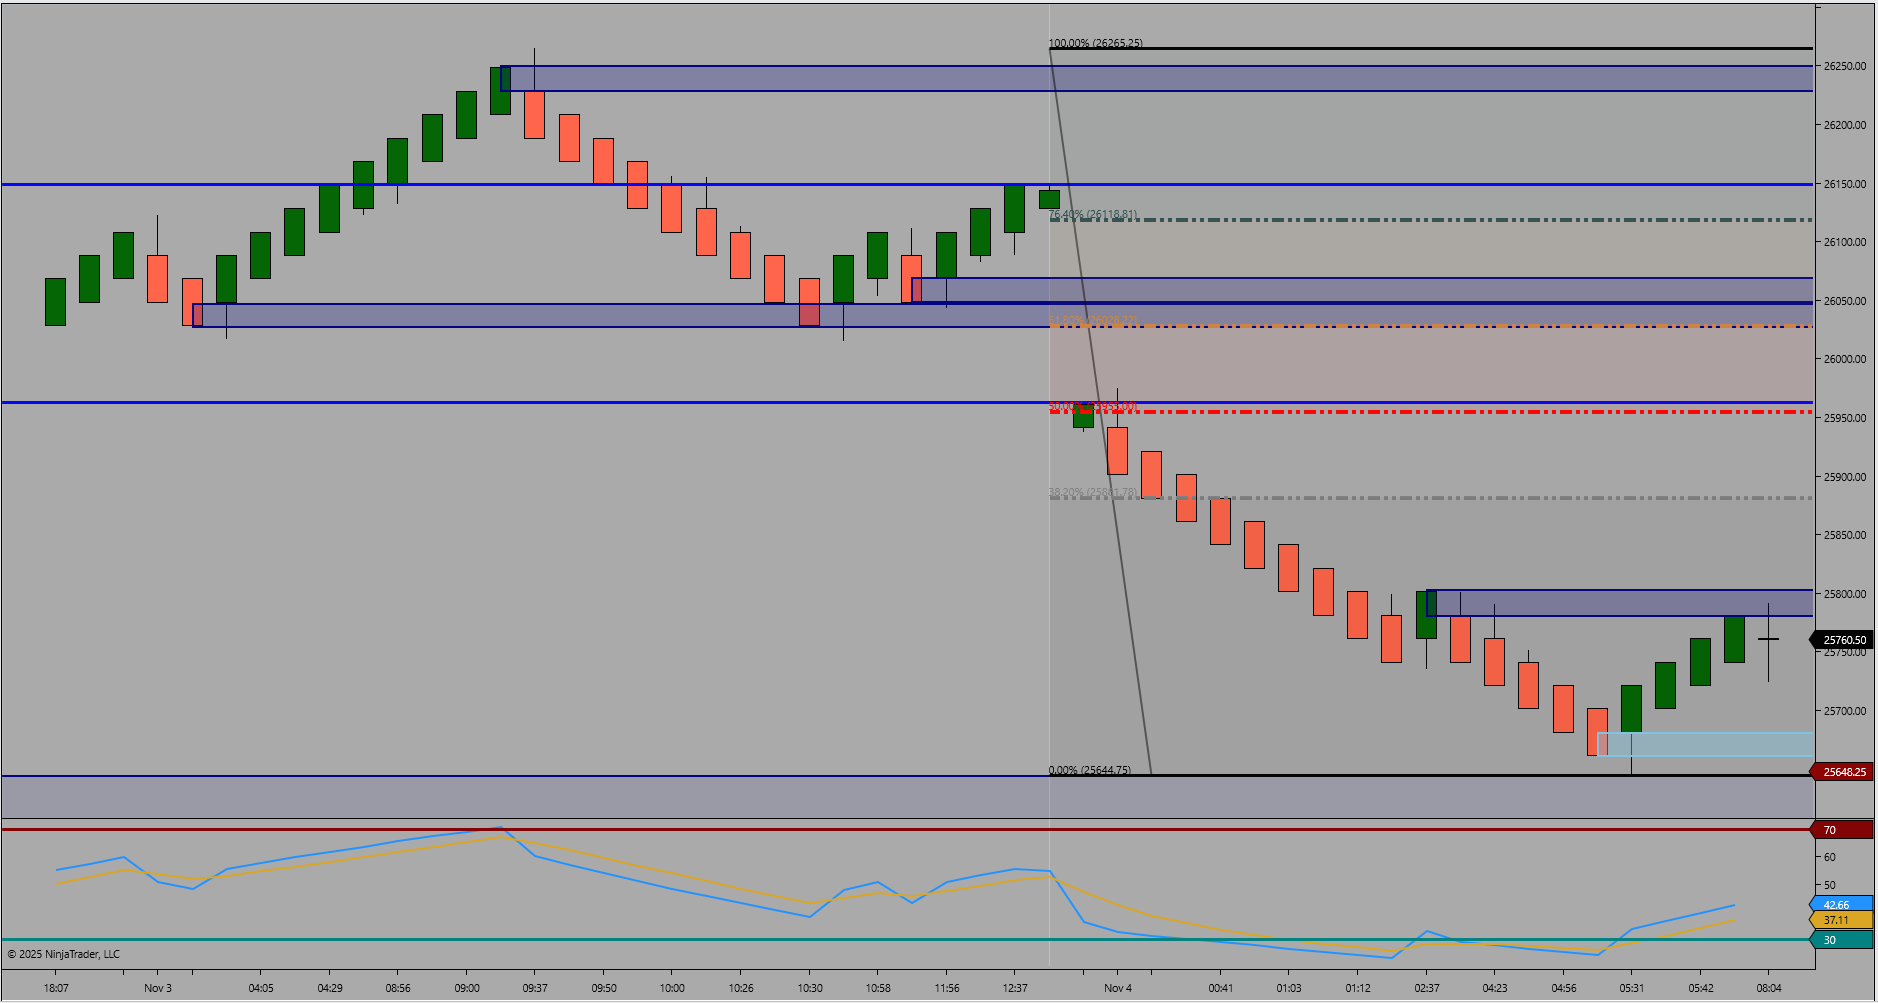
Figure 1 – RTH/ETH Structure Recap
Today’s ETH Framework
Overnight trade opened sharply lower at 25940.75, creating a large gap down from the prior RTH close at 26131.00. The gap zone between 26131.00 and 25940.75 reflects a clear structural imbalance and defines the current auction’s upper boundary. Price extended to a low of 25645.00 before recovering into early balance, with the ETH high reaching 25975.75. The recovery leg retraced partially into the gap zone but has not yet closed it, maintaining a downward-leaning tone with short-term reactive buying.
Today’s High Impact News
10:00 ET – USD JOLTs Job Openings | Sep
Bias and Structure Outlook
Bias – Neutral to Bearish with validation at 25950.00.
Structure remains in retracement mode after the overnight gap down. Continuation lower remains favored if price holds below 25950.00. A confirmed reclaim and hold above 26050.00 would indicate a full gap recovery and potential transition to balance.
Fibonacci Context
The current Fibonacci leg drawn from 26266.00 to 25645.00 outlines the active retracement window. The 38.2% level at 25854.75 and 50% level at 25955.00 align within the gap zone, creating a composite resistance layer. The 61.8% level near 26055.00 marks the final upside reaction point before structure completes a mean reversion test. Rejection from these levels would confirm sustained downward momentum, while a recovery through 26055.00 signals renewed equilibrium.
Key Levels
Type: Resistance Zone
Zone Range: 25950.00 – 26055.00
Comment: Active Fibonacci retracement and gap fill zone
Type: Resistance Zone
Zone Range: 26130.00 – 26150.00
Comment: RTH close reference and upper boundary of gap
Type: Support Zone
Zone Range: 25700.00 – 25645.00
Comment: ETH structural low and defended base
Type: Trigger Level
Zone Range: 25950.00
Comment: Validation threshold for continuation or rotation
Bias Summary
Untested HTF Structure High – 26266.00
Untested HTF Structure Low – 25645.00
Validation Level – 25950.00
Continuation favored while price remains below validation; rotation expected above.
Trader Tip
Large overnight gaps often act as momentum traps. Price must reclaim and hold above the gap base to confirm that structure has transferred control back to buyers.
NQ Flow Report
It all begins with an idea.
Flow Report – Monday, November 3, 2025
Yesterday’s RTH Recap
Friday’s RTH session expanded through a broad recovery phase, trading between 25888.75 and 26199.50. Price built a clean series of higher lows throughout the session, reclaiming prior midrange structure and closing near resistance. Momentum remained constructive with clear buyer control, signaling an upward continuation sequence into the new week.
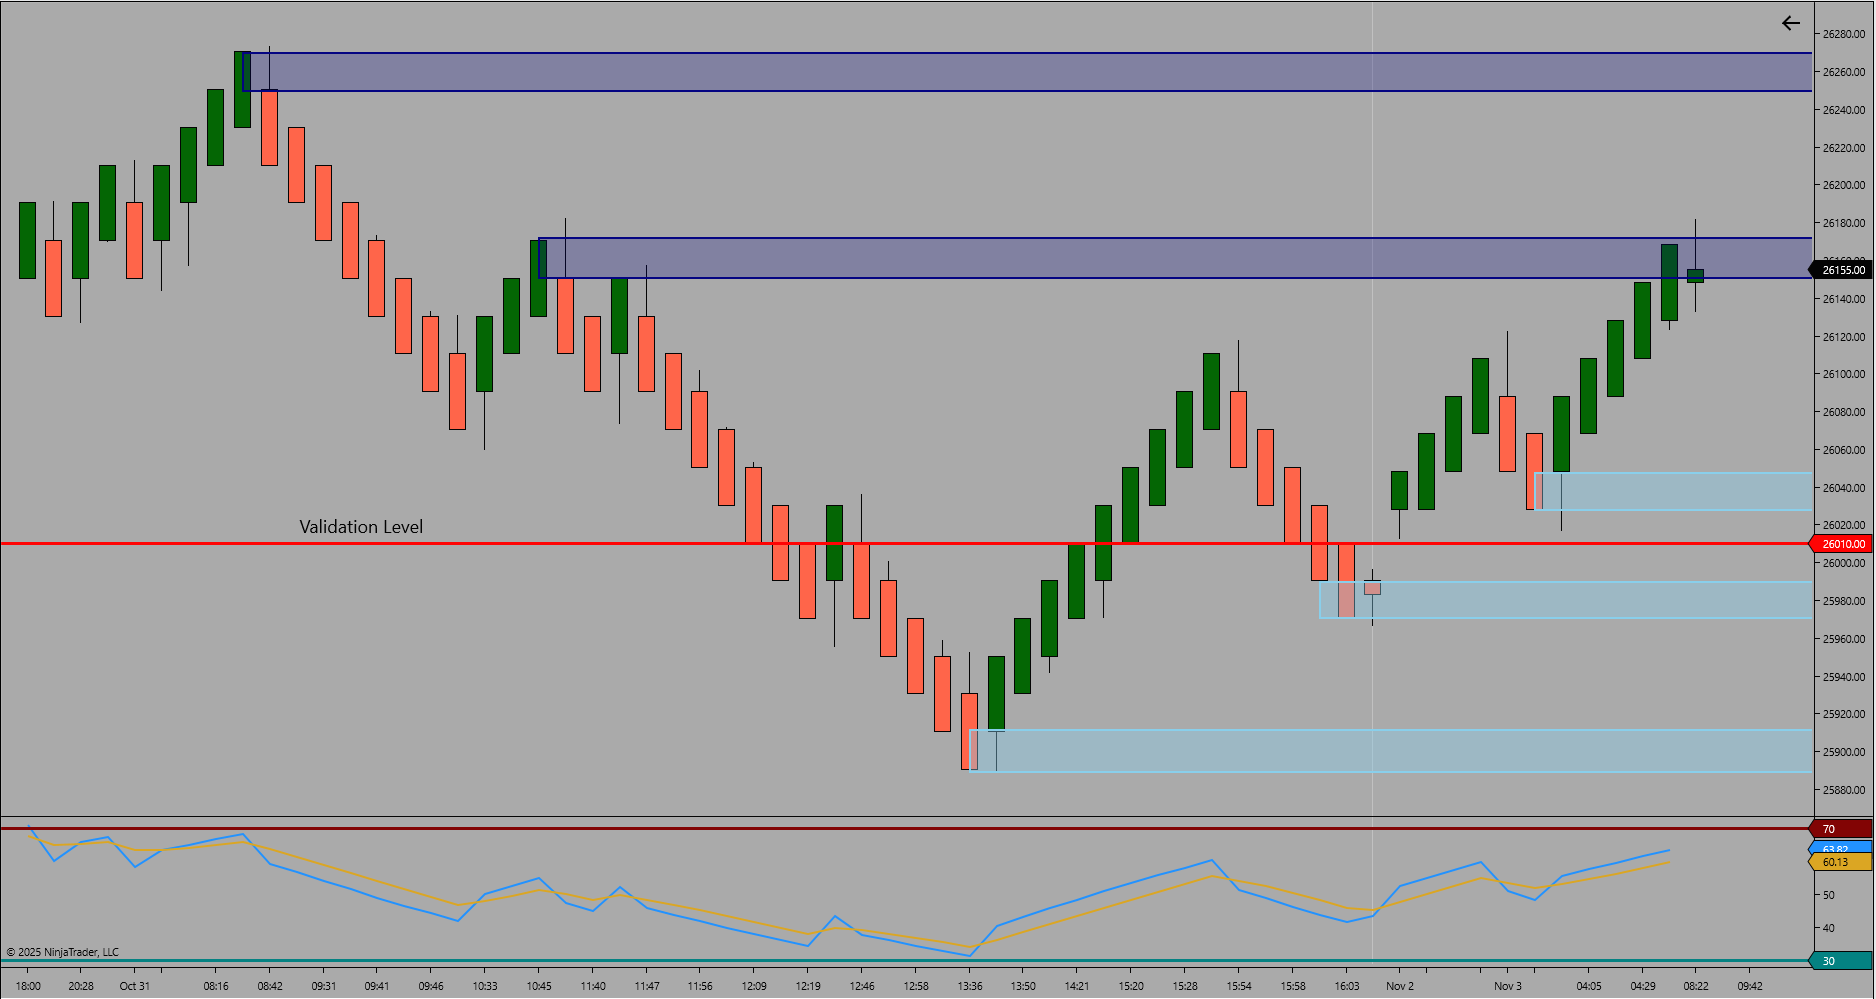
Figure 1 – RTH/ETH Structure Recap
Today’s ETH Framework
Overnight trade balanced within a tighter structure between 26012.75 and 26182.00. Price tested the upper resistance boundary but has yet to break through with conviction. The defended ETH low near 26012.75 aligns with prior RTH support, maintaining bullish structural tone while momentum compresses beneath the upper resistance zone.
Today’s High Impact News
10:00 ET – USD ISM Manufacturing PMI | Oct
Bias and Structure Outlook
Bias – Bullish with validation at 26010.00.
Continuation remains favored while price holds above 26010.00. A confirmed break through 26200.00 opens the next expansion leg, while rotation back below 26010.00 would likely revisit 25900.00 structure support.
Key Levels
Type: Resistance Zone
Zone Range: 26180.00 – 26199.50
Comment: ETH and RTH high cluster acting as upper cap
Type: Resistance Zone
Zone Range: 26260.00 – 26280.00
Comment: Higher resistance zone from untested prior structure
Type: Support Zone
Zone Range: 26040.00 – 26010.00
Comment: ETH structural base and validation level
Type: Support Zone
Zone Range: 25940.00 – 25900.00
Comment: Lower defended RTH structure and prior pullback base
Type: Trigger Level
Zone Range: 26010.00
Comment: Validation threshold for continuation or rotation
Bias Summary
Untested HTF Structure High – 26280.00
Untested HTF Structure Low – 25888.75
Validation Level – 26010.00
Continuation favored while price holds above validation; rotation expected below.
Trader Tip
When price consolidates beneath resistance within a higher-timeframe uptrend, sustained defense of nearby support often precedes a breakout continuation.
NQ Flow Report
It all begins with an idea.
Flow Report – Tuesday, October 28, 2025
Yesterday’s RTH Recap
Monday’s RTH session extended the prior advance, trading between 25796.50 and 26013.50. Price maintained a consistent upward rhythm, with buyers defending each pullback and holding control into the close. Momentum remained firmly positive as structure built a series of higher lows, confirming continued trend alignment from the prior week’s expansion.
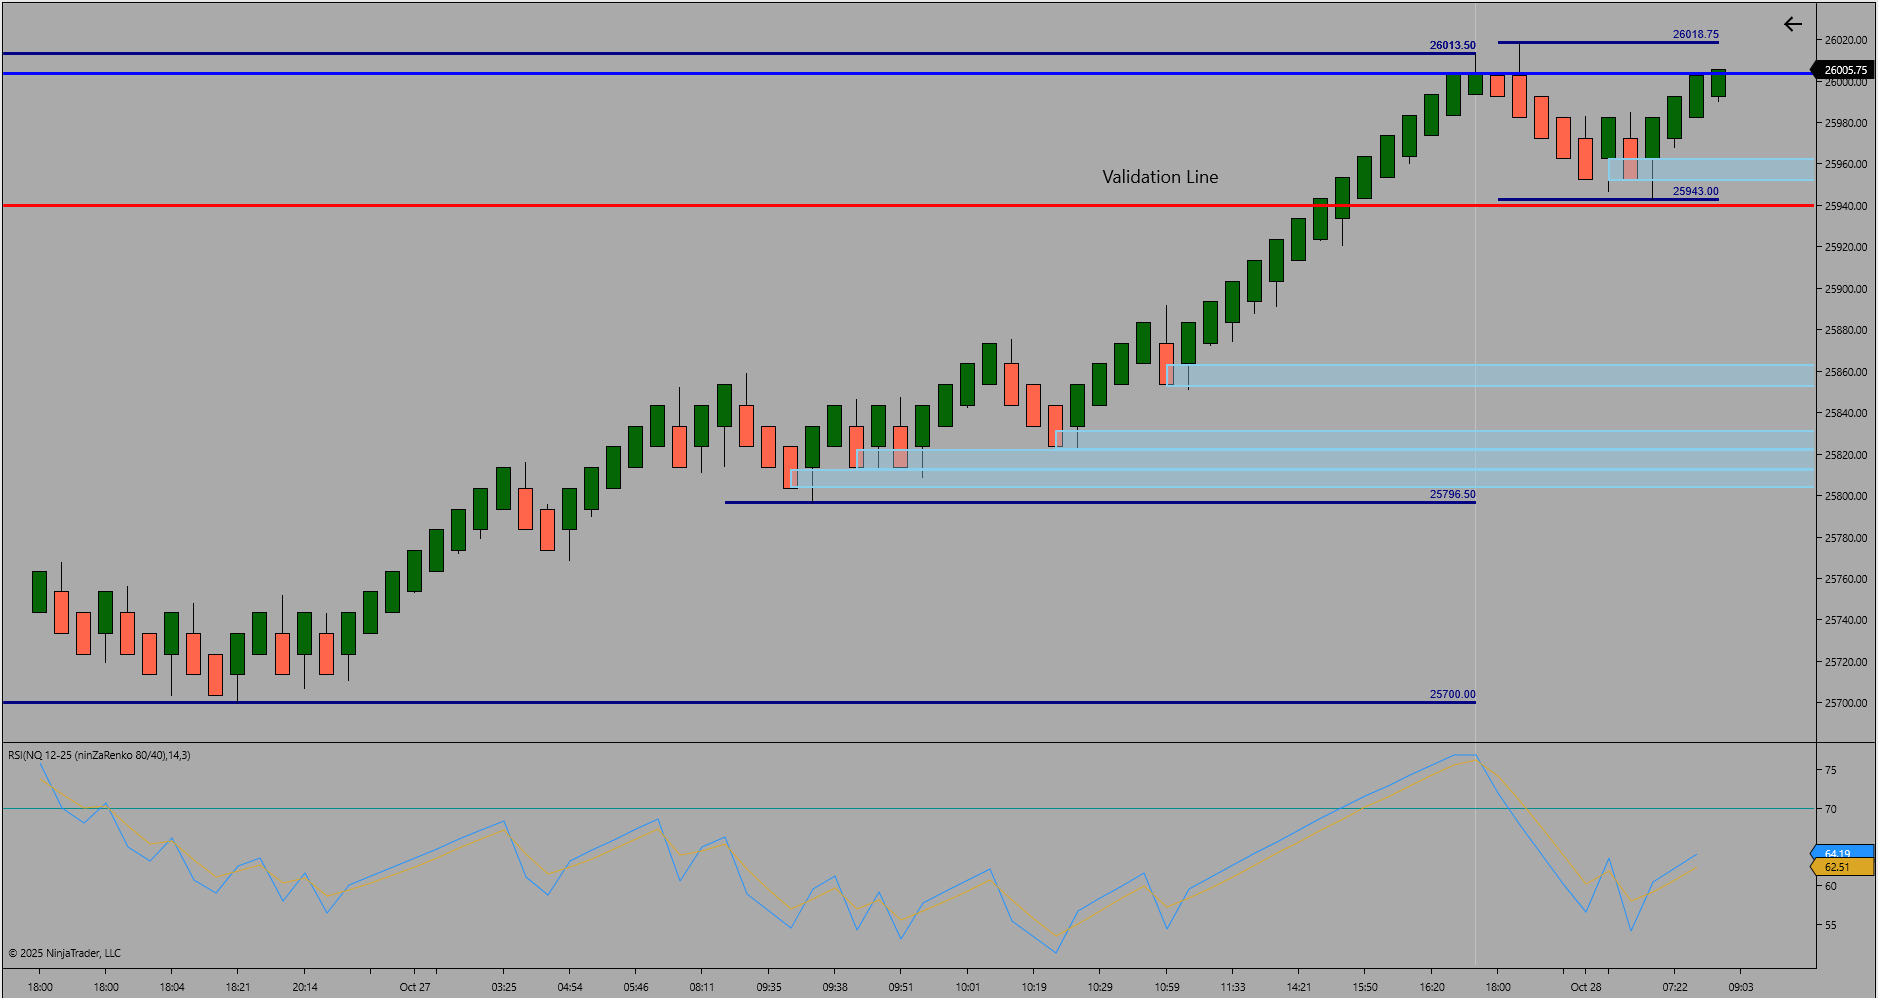
Figure 1 – HTF RTH Structure Recap
Today’s ETH Framework
Overnight trade continued to consolidate near the upper boundary, printing a high of 26018.75 and a low of 25943.00. Earlier ETH action briefly tested below 25950.00 but recovered quickly, signaling support defense within elevated balance. The prior ETH low from 25700.00 remains a key structural reference beneath the current range. Price continues to hold firm near new structural highs, with rotation potential inside 25950.00–26000.00 before directional confirmation into the open.
Bias and Structure Outlook
Bias – Bullish with validation at 25940.00.
Continuation remains favored while price holds above 25940.00. Sustained trade through 26020.00 confirms ongoing expansion, while a failure below 25940.00 could open a rotation toward 25800.00. Structure remains supported with clear momentum alignment at the upper edge of the current range.
Key Levels
Type: Resistance Zone
Zone Range: 26013.50 – 26018.75
Comment: RTH and ETH high cluster, active breakout cap
Type: Support Zone
Zone Range: 25960.00 – 25940.00
Comment: ETH defended base and validation zone
Type: Support Zone
Zone Range: 25810.00 – 25796.50
Comment: RTH low region and prior session structural demand
Type: Support Zone
Zone Range: 25710.00 – 25700.00
Comment: ETH structural base and deeper support reference
Type: Trigger Level
Zone Range: 25940.00
Comment: Validation threshold for continuation or rotation
Bias Summary
Untested HTF Structure High – 26018.75
Untested HTF Structure Low – 25700.00
Validation Level – 25940.00
Continuation favored while price holds above validation; rotation expected below.
Trader Tip
When structure compresses beneath new highs, sustained defense of near-term support often precedes the next phase of directional continuation.
NQ Flow Report
It all begins with an idea.
Flow Report – Monday, October 26, 2025
Friday’s RTH Recap
Friday’s RTH session balanced between 25570.75 and 25429.75 before closing near the upper boundary. The session held a steady two-sided rhythm following Thursday’s expansion, showing healthy consolidation within higher structure. The prior RTH low from 25429.75 held firm, maintaining the integrity of buyer control ahead of the weekend.
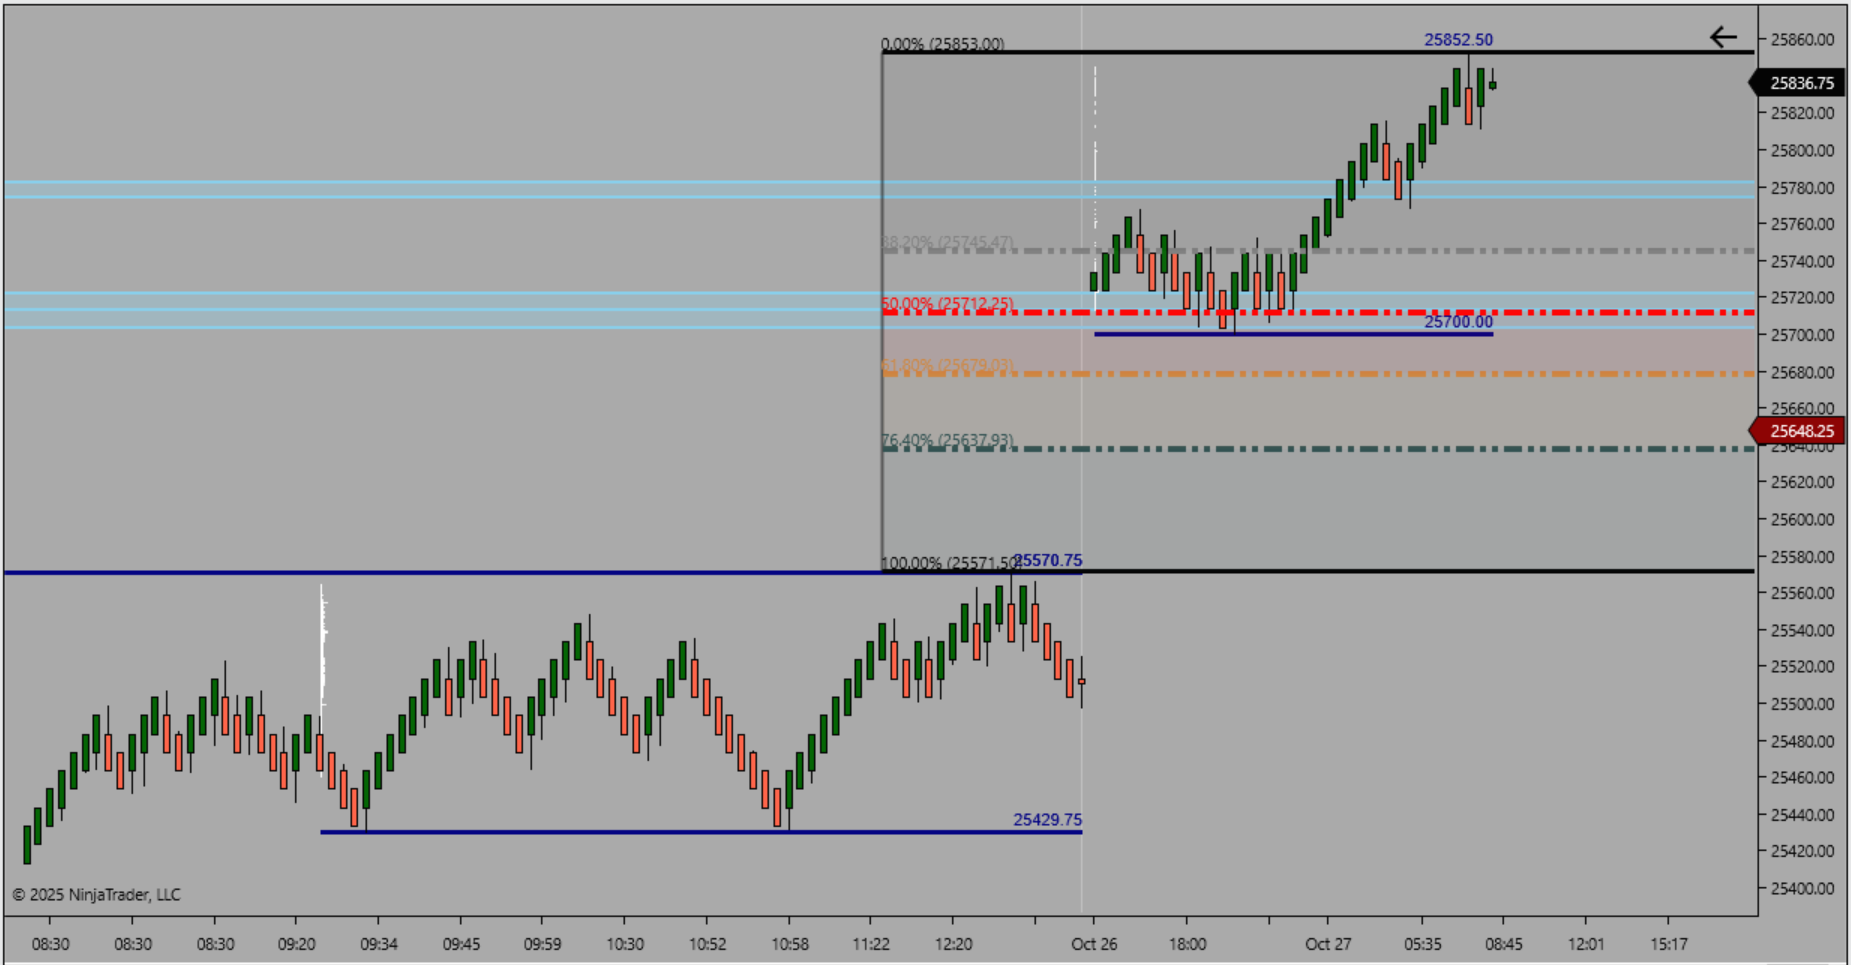
ETH Session with Fibonacci Levels
Today’s ETH Framework
Overnight trade opened with a gap up above Friday’s RTH high, creating a new structural range between 25700.00 and 25852.50. The gap zone between 25570.75 and 25700.00 marks the key continuation area for early session control. Price has maintained strong directional tone above the gap base, confirming upward momentum and reinforcing bullish bias as long as 25700.00 remains defended.
Bias and Structure Outlook
Bias – Bullish with validation at 25700.00.
Continuation is favored while price holds above 25700.00. Sustained trade through 25850.00 may open the next expansion phase. Failure back below 25700.00 would fill the gap zone toward 25570.75 and shift tone to short-term balance.
Key Levels
Type: Resistance Zone
Zone Range: 25830.00 – 25852.50
Comment: ETH high and potential breakout cap
Type: Support Zone
Zone Range: 25720.00 – 25700.00
Comment: ETH base and validation support level
Type: Support Zone
Zone Range: 25570.75 – 25550.00
Comment: Gap-up zone lower boundary and RTH high reference
Type: Support Zone
Zone Range: 25440.00 – 25430.00
Comment: RTH defended structure
Type: Trigger Level
Zone Range: 25700.00
Comment: Validation threshold for continuation or rotation
Bias Summary
Untested HTF Structure High – 25852.50
Untested HTF Structure Low – 25276.00
Validation Level – 25700.00
Continuation favored while price holds above validation; rotation expected below.
Trader Tip
Gaps that hold above their base often act as launch zones for structural continuation when confirmed by higher low formation.
NQ Flow Report
It all begins with an idea.
Weekly Market Structure Outlook – Nasdaq Futures
(Week of October 27, 2025)
Structural Context Summary
Nasdaq futures continue to consolidate near newly established all-time highs. Price maintained an extended structure throughout last week, trading above prior defended bases while compressing near the upper expansion band. Overall tone remains balanced with sustained momentum control but limited directional follow-through.
Friday RTH Session Review
Friday’s RTH session rotated around the newly printed all-time high, showing controlled two-sided trade after the earlier week’s expansion. Buyers defended local structure on minor pullbacks, while sellers capped progress near 25570.75. The session closed near the upper edge of the range, suggesting balance rather than directional continuation into the weekend.

Weekly Market Picture
Weekly Structure Overview
The prior week established a strong expansion leg from 24804.75 to 25570.75, breaking through the previous all-time-high barrier marked at 25394.75. After the breakout, price held elevated structure and compressed into balance near the new highs. Midweek rotations defended prior breakout zones, confirming the shift from expansion to consolidation. The weekly rhythm reflects equilibrium between momentum retention and structural digestion at the upper boundary.
Momentum Context and Structural Behavior
Momentum remained stable throughout the week. Early-week strength transitioned into controlled rotation as buyers defended the 25276.00–25296.00 region while failing to sustain higher-velocity continuation beyond 25500. The rotation phase indicates healthy consolidation above prior resistance, establishing a higher-time-frame base for future directional development.
Key Structural Levels
Support Zone 25276.00 – 25296.00
Comment: Upper structural base from midweek defense
Support Zone 24955.75 – 25010.00
Comment: Prior defended foundation during lower-range retest
Support Zone 24804.75 – 24937.00
Comment: Weekly expansion origin and confirmed higher-time-frame base
Resistance Zone 25338.25 – 25368.00
Comment: Former upper supply zone now acting as intermediate balance ceiling
Resistance Zone 25503.25 – 25570.75
Comment: All-time-high cluster; active upper boundary of expansion
Structural Milestones
Untested Weekly Structure High – 25570.75
Untested Weekly Structure Low – 24804.75
Continuation favored on expansion above 25570.75; rotation expected while contained within the current upper balance range.
Bias and Outlook
Bias – Neutral
The market enters the week balanced near structural highs. Continuation requires decisive momentum through 25570.75, while sustained trade back under 25338.00 could invite rotation toward the mid-range foundation. With no major macro catalysts early in the week, structure favors measured balance until new participation emerges.
Educational Insight / Trader Tip
Momentum can pause without reversing. Recognizing rotation at new highs prevents emotional positioning and reinforces patience during consolidation phases.
Weekly Reflection
Structure evolves from expansion into balance before new momentum phases emerge. The professional trader’s edge lies in reading those transitions and preparing before volatility returns.