

NQ Flow Report
Friday, November 7, 2025
Yesterday’s RTH Recap
Thursday’s RTH session ranged between 25822.25 and 25197.75. Price extended the prior downtrend, with multiple attempts to stabilize inside lower structural support that ultimately failed to reclaim momentum. Sellers maintained control throughout the session, closing near the lower boundary of the day’s range.
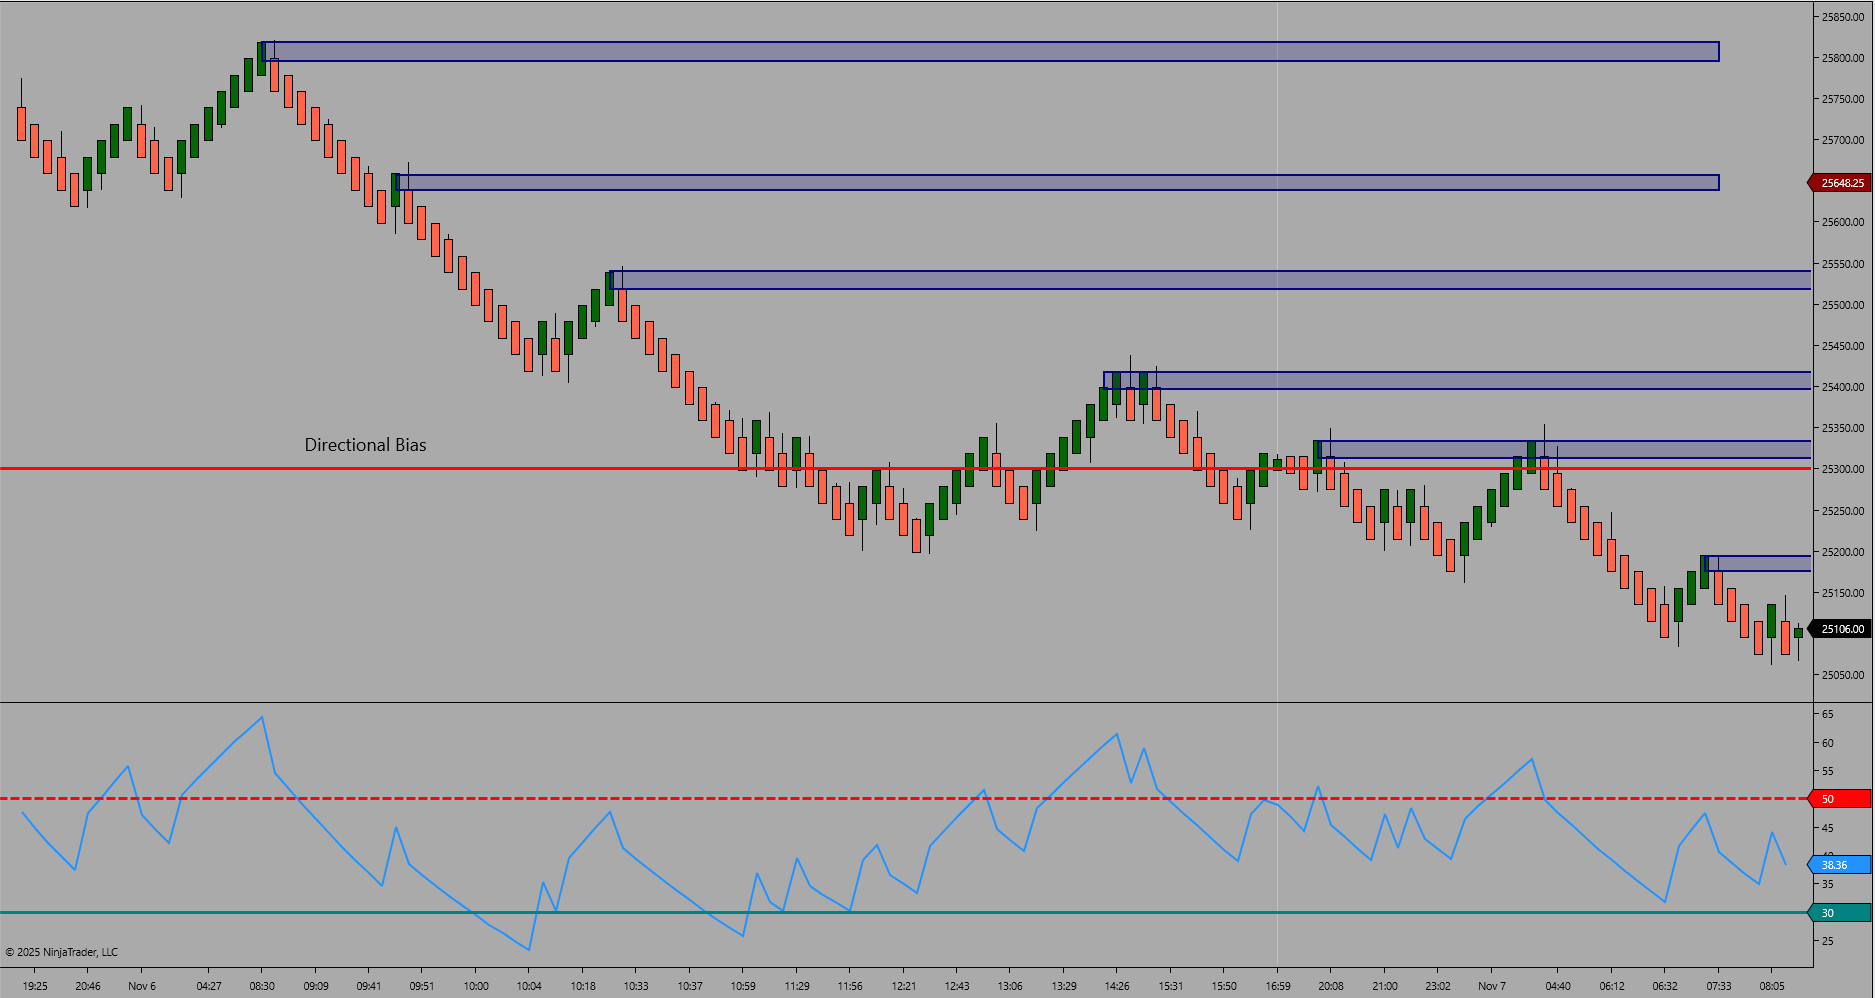
Figure 1 – RTH/ETH Structure Recap
Today’s ETH Framework
Overnight ETH activity continued the decline, printing a high of 25354.75 and a low of 25067.75. Price is now trading near the edge of the prior macro base, where 24937.00 remains the next structural low to monitor. The ETH profile shows a slow, controlled descent, indicating continuation pressure unless buyers defend within the current zone.
Bias and Structure Outlook
Bias – Bearish with Caution.
Momentum remains weak across the structure, with sellers maintaining advantage below 25300. A recovery above this zone would be the first sign of structure reclaim. If 25050.00 breaks, continuation toward the 24937.00 macro low becomes increasingly probable.
Key Levels
Type: Resistance Zone
Zone Range: 25300.00 – 25350.00
Comment: Upper ETH rejection cluster and short-term cap
Type: Support Zone
Zone Range: 25050.00 – 24950.00
Comment: Active macro support and potential rebound base
Type: Trigger Level
Zone Range: 25300.00
Comment: Structural validation threshold for short-term reversal attempts
Bias Summary
Untested HTF Structure High – 25354.75
Untested HTF Structure Low – 24937.00
Validation Level – 25300.00
Continuation lower remains favored while below validation; reclaiming above 25300.00 would neutralize the bearish sequence.
Trader Tip
Momentum exhaustion rarely resolves instantly—wait for a full reclaim above validation before assuming structure shift.