

NQ Flow Report
Wednesday, November 5, 2025
Yesterday’s RTH Recap
Tuesday’s RTH session traded between 25893.50 and 25642.25, holding a controlled downward tone within an established bearish leg. Price attempted to reclaim midrange control early in the session but failed to sustain above 25850.00, resulting in a steady continuation lower into the close. The session confirmed structure alignment with the broader 160-frame momentum, which remains under compression.
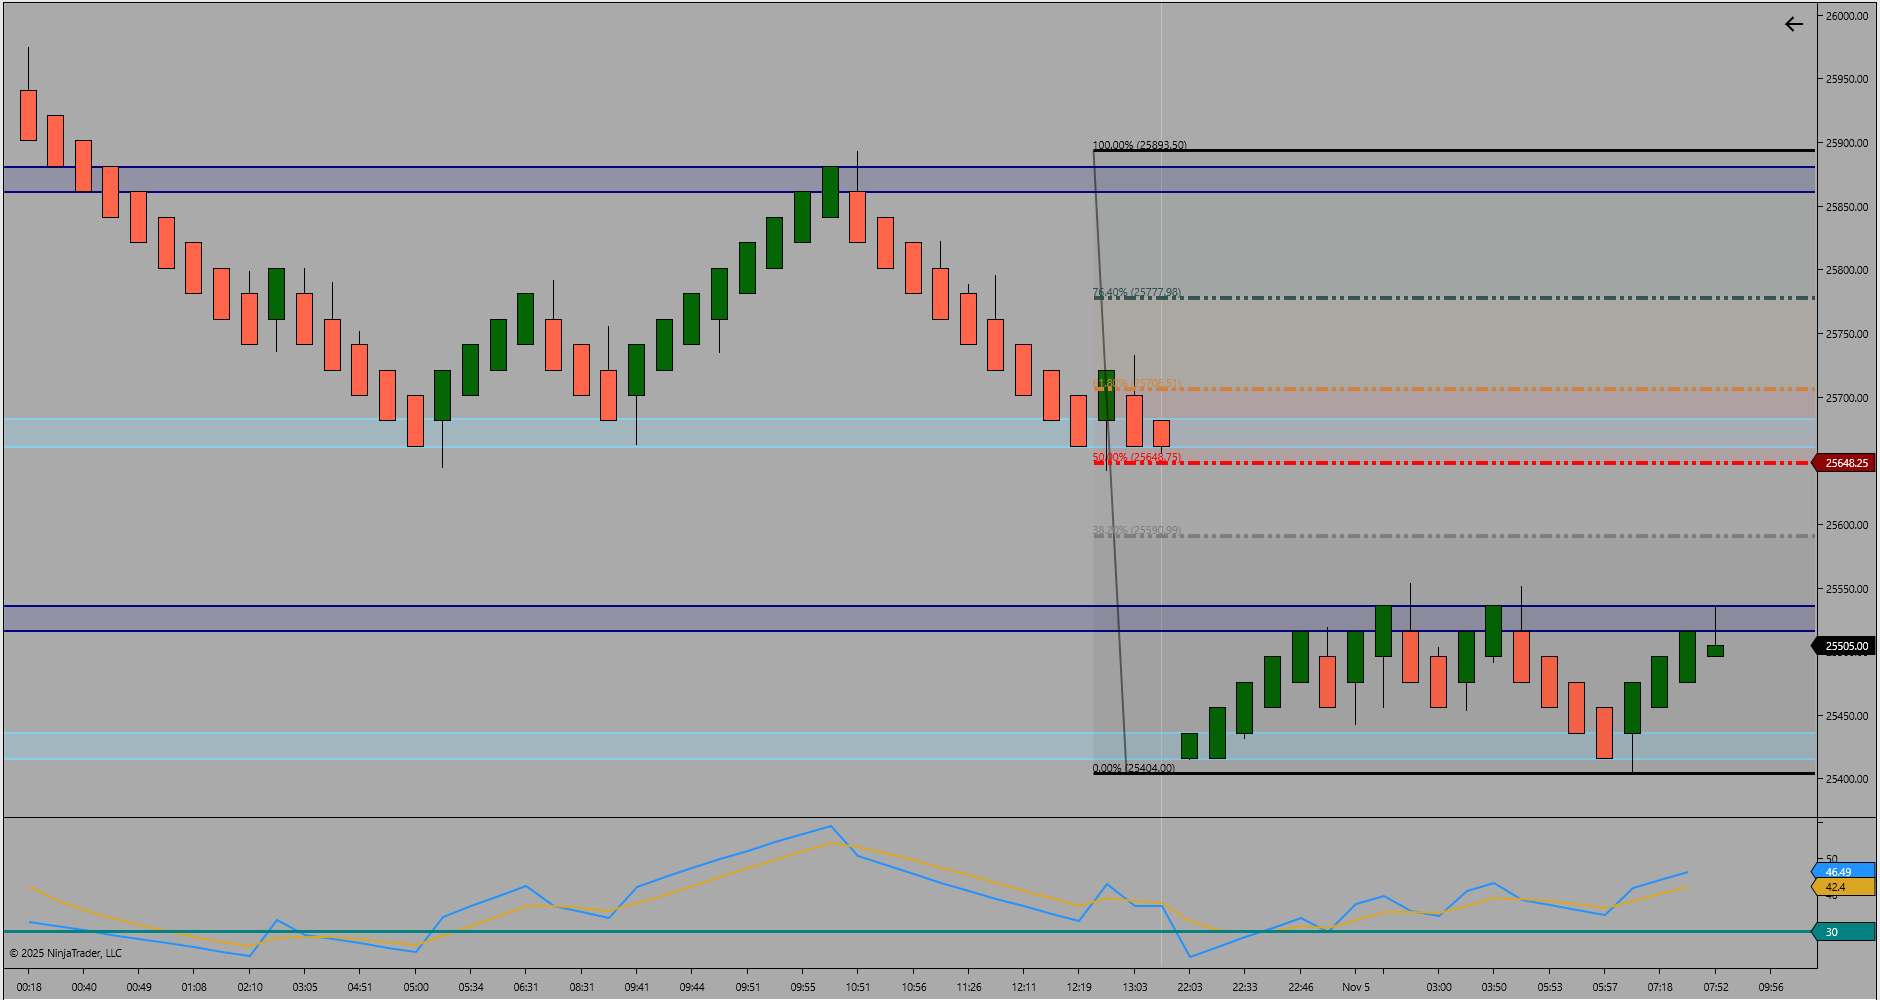
Figure 1 – RTH/ETH Structure Recap
Today’s ETH Framework
Overnight ETH trade extended the lower structural range, printing a high of 25554.00 and a low of 25404.00. The narrow ETH range reflects ongoing contraction after Monday’s gap down, with price remaining inside the lower half of the broader leg. The prior ETH high of 25975.75 remains untested and defines the upper reference for any recovery attempt. Price is stabilizing near the lower end of the structure but continues to trade below the 25700.00 validation threshold.
Bias and Structure Outlook
Bias – Bearish with validation at 25700.00.
Continuation lower is favored while price remains below 25700.00. A sustained break above 25700.00 would shift tone to neutral and open rotation toward 25850.00. Current conditions remain range-bound beneath resistance, with momentum still contracting within a bearish framework.
Fibonacci Context
The current Fibonacci retracement drawn from 25975.75 to 25404.00 outlines the active retracement window for today’s session. The 38.2% retracement near 25630.00 and the 50% midpoint at 25690.00 align closely with the lower resistance zone, forming the initial reaction band for sellers. The 61.8% retracement at 25750.00 represents the upper pivot where structure would likely determine continuation or reversal. Holding below the 50%–61.8% cluster confirms bearish control, while a full reclaim through 25750.00 would indicate recovery toward prior session midrange.
Key Levels
Type: Resistance Zone
Zone Range: 25690.00 – 25750.00
Comment: Active Fibonacci retracement and short-term control band
Type: Resistance Zone
Zone Range: 25850.00 – 25890.00
Comment: Prior RTH rejection zone
Type: Support Zone
Zone Range: 25500.00 – 25400.00
Comment: ETH structural base and defended demand
Type: Trigger Level
Zone Range: 25700.00
Comment: Validation threshold for continuation or rotation
Bias Summary
Untested HTF Structure High – 25975.75
Untested HTF Structure Low – 25404.00
Validation Level – 25700.00
Continuation favored while price remains below validation; rotation expected above.
Trader Tip
Fibonacci retracement clusters often mark the shift between reactive pullbacks and true reversals—watch for compression or rejection at 25700.00 to define today’s directional control.